 TechAnalyzer Pro
The US market this week: sectors and indices, Nov 2–6, 2026
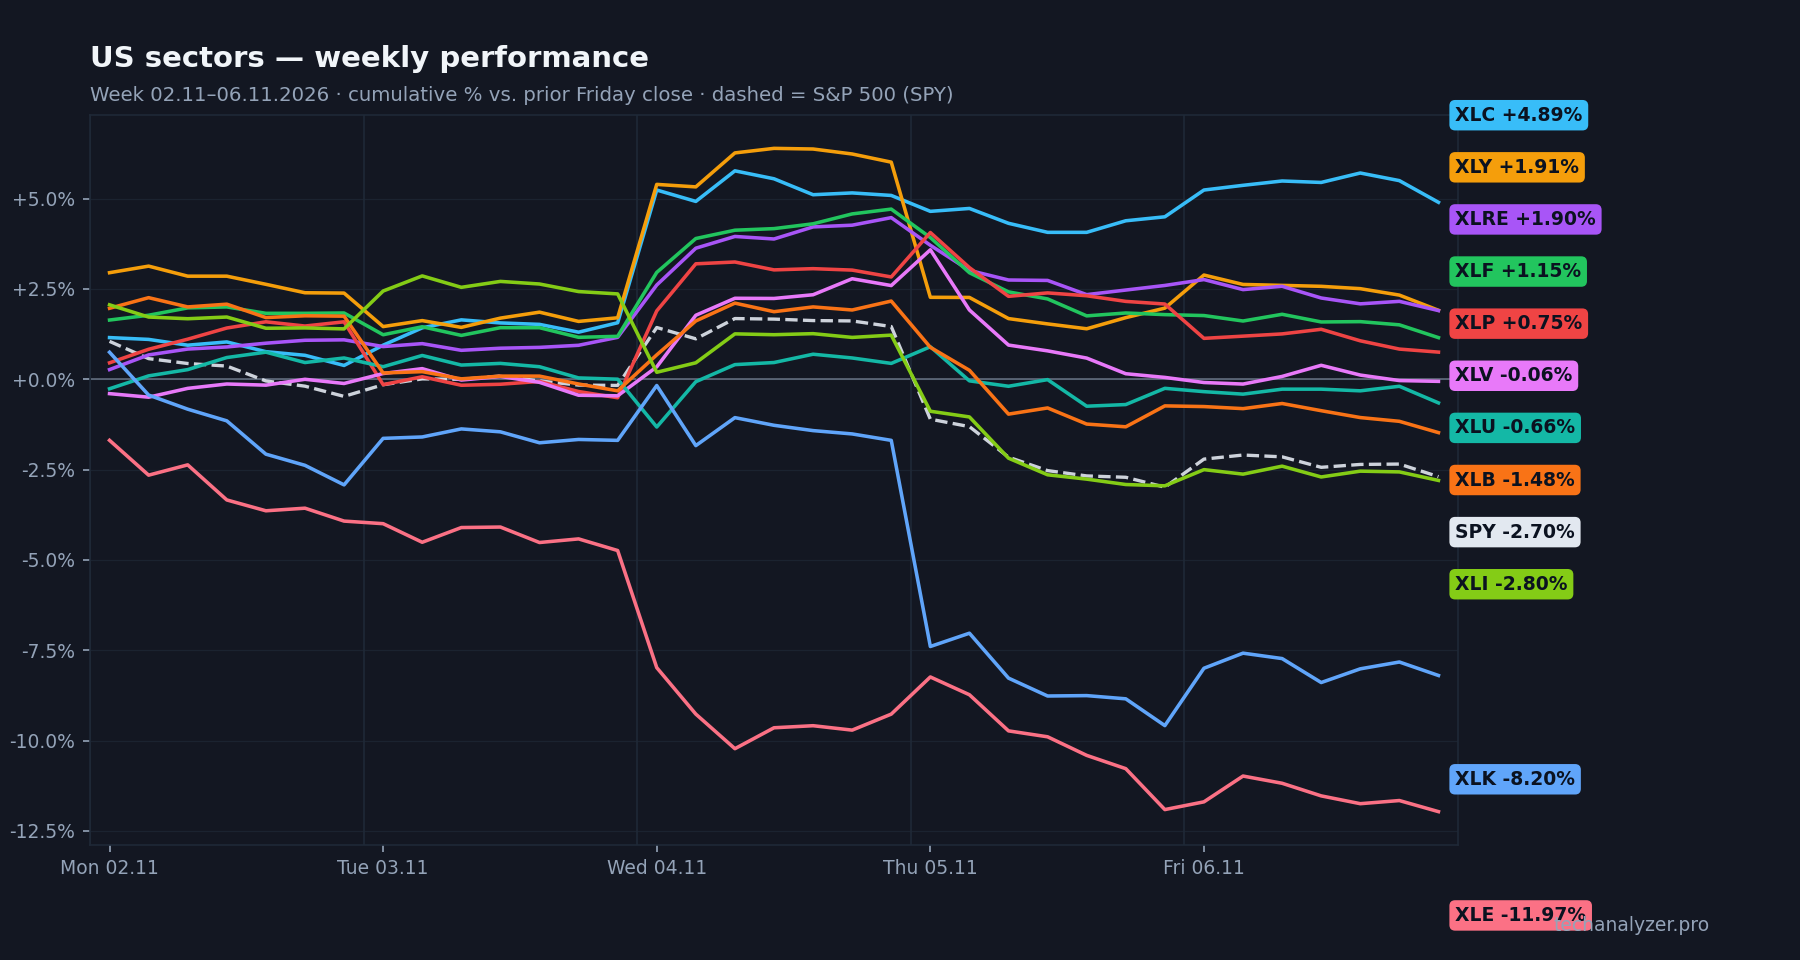
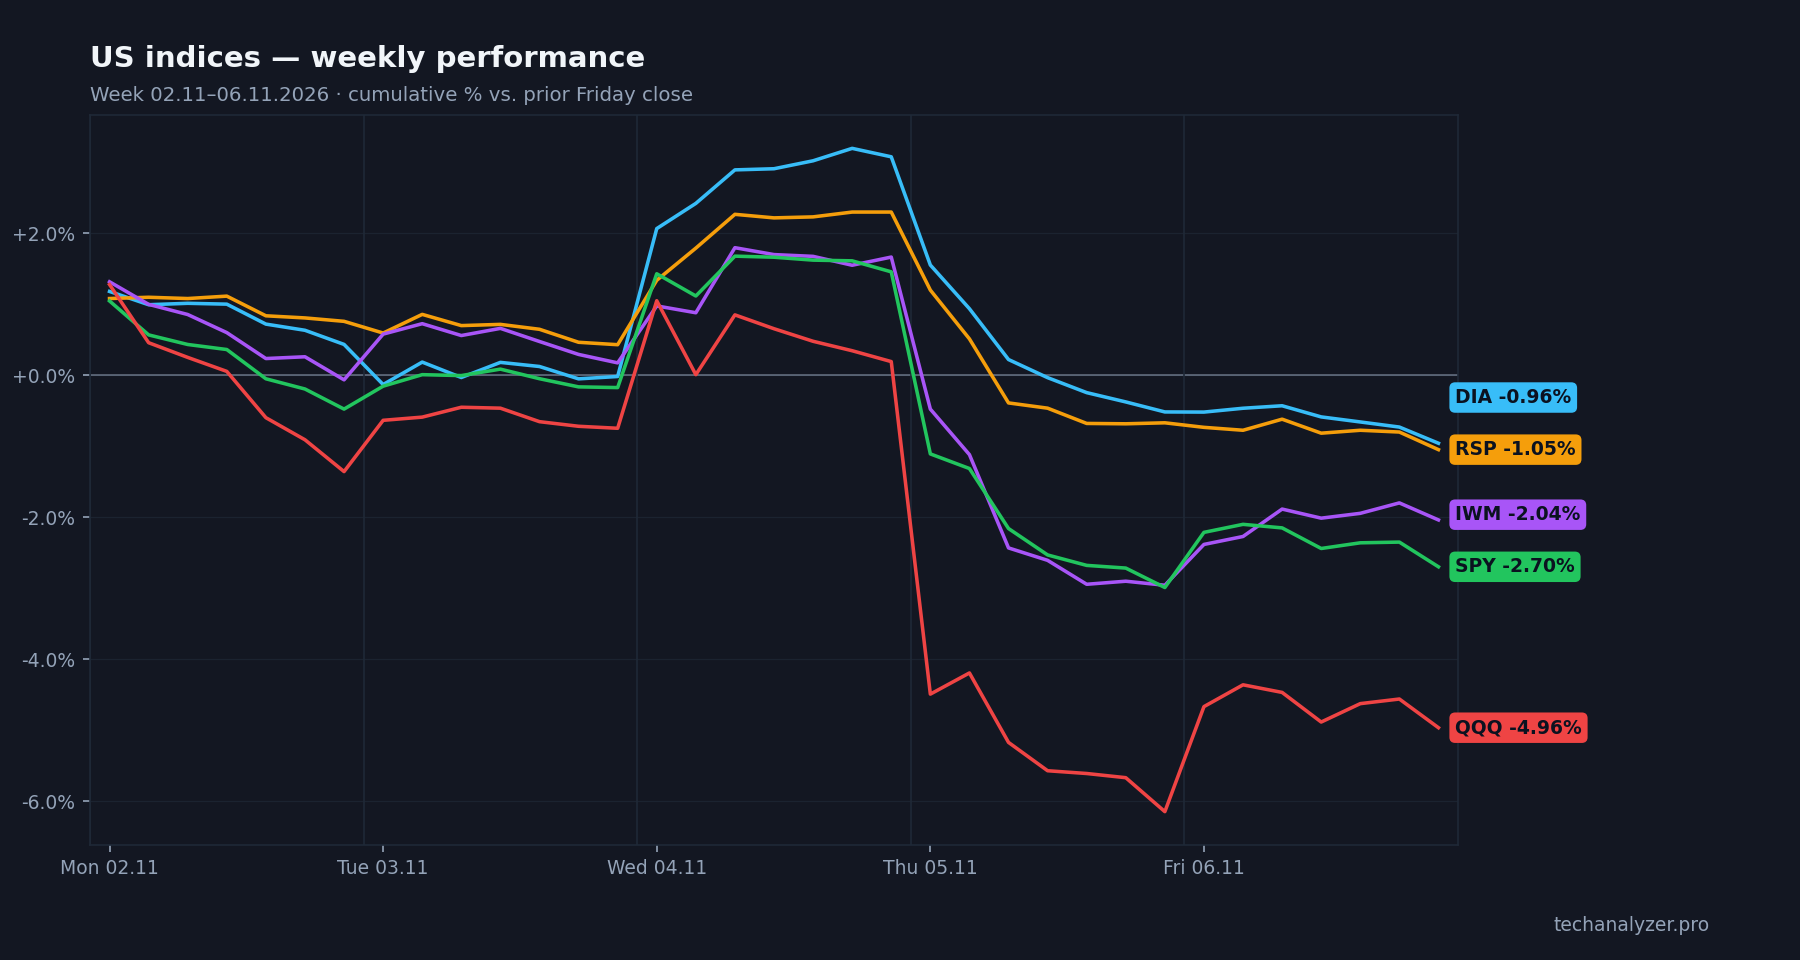
Cumulative return through the US trading week, measured from the prior Friday's close, using the ETFs for the 11 S&P 500 sectors and the five major indices. Published automatically once a week from the same data that runs our scanner. For longer-term context, see stock market seasonality by month.
The 11 sectors vs. the S&P 500
To share: download the image · click the chart to open it full size · the link to this page is permanent.
The indices
The week in numbers
The strongest sector this week was Communication Services (XLC, +4.89%); the weakest was Energy (XLE, -11.97%). 5 of 11 sectors finished the week higher.
Defensive sectors (consumer staples, utilities, health care) outpaced the cyclicals (in relative terms — the S&P 500 itself fell), a risk-off tilt.
The indices: S&P 500 -2.70%, Nasdaq-100 -4.96%, Dow Jones -0.96%, Russell 2000 -2.04%, S&P 500 Equal Weight -1.05%.
The equal-weight S&P 500 beat the cap-weighted index: the average stock did better than the index, so the move was broad rather than carried by the megacaps.
Small caps (Russell 2000) beat big tech (Nasdaq-100).
This text is derived from the numbers alone and describes the week that was. It is not a forecast and not investment advice.
Previous weeks
Oct 26–30, 2026Oct 19–23, 2026Oct 12–16, 2026Oct 5–9, 2026Sep 28 – Oct 2, 2026Sep 21–25, 2026Sep 14–18, 2026Sep 7–11, 2026
More on TechAnalyzer Pro
Daily analysis for every stockThe 12-1 momentum paper portfolioTheme indicesTrading guides