 TechAnalyzer Pro
Illumina Inc ILMN
Aktienrecherche im Klartext · As of Nov 03, 2026 · updated once a week, after the trading week closes
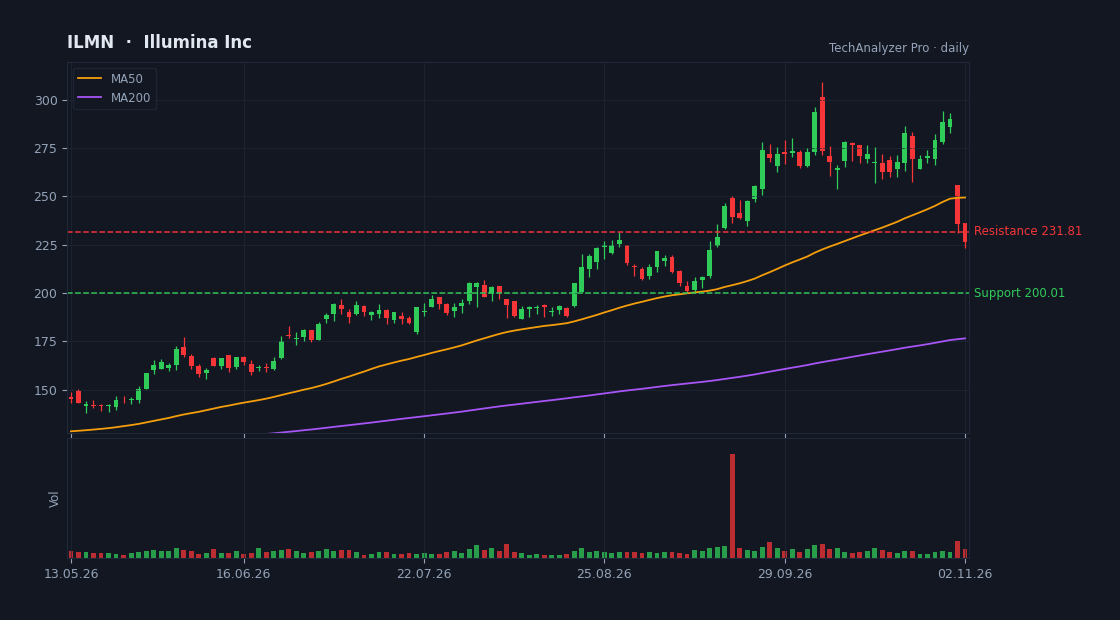
Daily candles, 50 and 200-day averages and volume · updated every trading day · click to open the live chart
Das Endergebnis
The stock is driven by sequencing consumables revenue and NovaSeq X instrument placements, which also set the margin path. The quarter beat ($1.44 vs $1.36) and guidance was raised, yet the shares fell 16.4% in the week while the S&P 500 fell 1.73% and the sector ETF rose 2.97%. At about 39 times earnings, close to the sector median of 37.6, the valuation embeds continued growth and margin gains, while actual growth is 4.2% year-on-year and revenue fell 2.6% from the prior quarter. The central tension: strong clinical demand and $378 million of quarterly free cash flow against weak research markets, $2.31 billion of debt versus $1.34 billion of cash, and high volatility (beta 1.45).
Eine Erklärung der Mechanik anhand der Fakten auf dieser Seite, kein Ratschlag.
Was das Unternehmen macht
Illumina Inc is a large-cap company in the Healthcare sector (Diagnostics & Research), with a market value of $34.3B, based in the USA.
It employs about 8,600 people and has been listed since Jul 28, 2000.
Illumina, Inc. provides sequencing- and array-based solutions for genetic and genomic analysis in the Americas, Europe, Greater China, the Asia Pacific, the Middle East, and Africa. The company offers sequencing- and array-based instruments and consumables, which include reagents, flow cells, and library preparation; whole-genome sequencing kits, which sequence entire genomes of various size and complexity; and targeted resequencing kits, which sequence exomes, specific genes, and RNA or other genomic regions of interest.
Billig oder teuer? preislich im Einklang mit seiner Gruppe
Its price-to-earnings (P/E) is 39.0 versus 37.6 for the median of the Healthcare sector in our universe (25 companies) — priced in line with its group.
Der Umsatz wächst im Vergleich zum Vorjahresquartal um 4 %.
Auf Grundlage der Analystenumsatzprognosen für das nächste Jahr sinkt die Kennzahl auf 38,5 — die Analysten erwarten höhere Gewinne.
The average analyst price target is 261.60, 16% above the current price (their view, not ours).
Die Aktie liegt bei 58 % ihrer einjährigen Spanne (0 % = Tief, 100 % = Hoch).
Die Risiken
- • Die Aktie ist volatiler als der Durchschnitt (Beta 1,5) – große tägliche Bewegungen in beide Richtungen.
Stärken
- ✅ Profitabel – 20 von 100 Dollar Umsatz bleiben als Gewinn übrig.
- ✅ Erzeugt freien Cashflow – Gewinn wird zu Bargeld auf der Bank.
Worüber der Markt diese Woche spricht
A beat and a raised outlook, yet the stock fell sharply during the week.
- Illumina reported third-quarter revenue of $1.13 billion, up 4.2%, with adjusted earnings per share of $1.44 versus the $1.36 analysts expected. [1] [3] [4]
- Management raised its FY26 outlook to revenue of $4.64-$4.66 billion and adjusted EPS of $5.40-$5.45, up from $5.30-$5.40 previously. [1] [3]
- Despite the beat, the market reaction to the quarter was negative; the company acknowledged continued weakness in research and applied markets. [3]
- Analysts asked whether high NovaSeq X instrument placements were pulled-forward orders; CEO Jacob Thaysen said the pace reflects normal business. [3]
- Greater China revenue was $59 million, 5.2% of sales, well above the $34.55 million expected; Europe, Middle East, Africa and Latin America contributed $347 million. [4]
Nur eine Zusammenfassung der folgenden Artikel, jeder Punkt mit seiner Quelle. Keine Prognose, keine Empfehlung.
Was Sie sehen sollten
- Whether current-quarter revenue approaches the $1.22 billion analysts expect, after a 2.6% sequential decline. [4]
- Delivery against the raised FY26 guidance of $4.64-$4.66 billion revenue and $5.40-$5.45 adjusted EPS. [1] [3]
- The pace of NovaSeq X placements and clinical consumables growth, which the CEO described as mid-teens percent. [3]
- Whether adjusted operating margin holds near 26% after rising from 20.9% a year ago, since it underpins earnings. [3]
Was sich diese Woche geändert hat
Over the past week the stock fell 16.4% (for comparison: S&P 500 -1.7%, sector ETF XLV +3.0%).
Das Unternehmen hat diese Woche seinen Quartalsbericht veröffentlicht – siehe die leicht verständliche Zusammenfassung oben.
Die Neuigkeiten dieser Woche
- 3 Stocks to Watch Following Guidance Upgrades finance.yahoo.com · 2026-11-02
A roundup of three healthcare firms raising guidance; Illumina reported $1.13 billion revenue, $1.44 adjusted EPS, and lifted its full-year revenue and EPS outlook. source ↗ - Forensic Technologies and Services - Global Strategic Business Report: Secure Share of a $44.7B Market by 2030 as Thermo Fisher, Illumina, Agilent and BAE Systems Accelerate AI-Led Forensics finance.yahoo.com · 2026-11-02
A commercial market report estimates forensic technologies growing from $24 billion to $44.7 billion by 2030; Illumina is named among the players in the field. source ↗ - The top 5 analyst questions from Illumina’s Q3 earnings call finance.yahoo.com · 2026-11-02
A recap of the earnings call: the market reacted negatively, adjusted operating margin was 26.2% versus 20.9% a year ago, and analysts pressed on NovaSeq X demand durability. source ↗ - Don't Overlook Illumina (ILMN) International Revenue Trends While Assessing the Stock finance.yahoo.com · 2026-11-02
A breakdown of Illumina's international revenue for the quarter: Greater China $59 million, EMEA and Latin America $347 million; analysts expect $1.22 billion for the current quarter. source ↗ - US Stock Market Today: S&P 500 Futures Edge Higher On ISM Manufacturing Test finance.yahoo.com · 2026-11-02
A daily market-open roundup focused on US manufacturing data and other stocks; it contains no new information about Illumina. source ↗ - Invesco S&P 500 Equal Weight (RSP) Buys $0.2 Million More Morgan Stanley on Thursday finance.yahoo.com · 2026-11-02
The Invesco RSP equal-weight ETF trimmed its Illumina holding by 1,680 shares, about $0.5 million, as part of a technical trim across 498 positions. source ↗
Was sich seit letzter Woche geändert hat
Dies ist die erste Zusammenfassung für diese Aktie; Ab nächster Woche zeigt dieser Abschnitt, was sich geändert hat.
Eine Beschreibung von Fakten aus den Einreichungen und dem Markt – keine Anlageberatung oder Empfehlung. „Billig“ und „teuer“ beziehen sich immer auf die Vergleichsgruppe.