 TechAnalyzer Pro
Before the Breakout: Amazon.com Inc (AMZN)
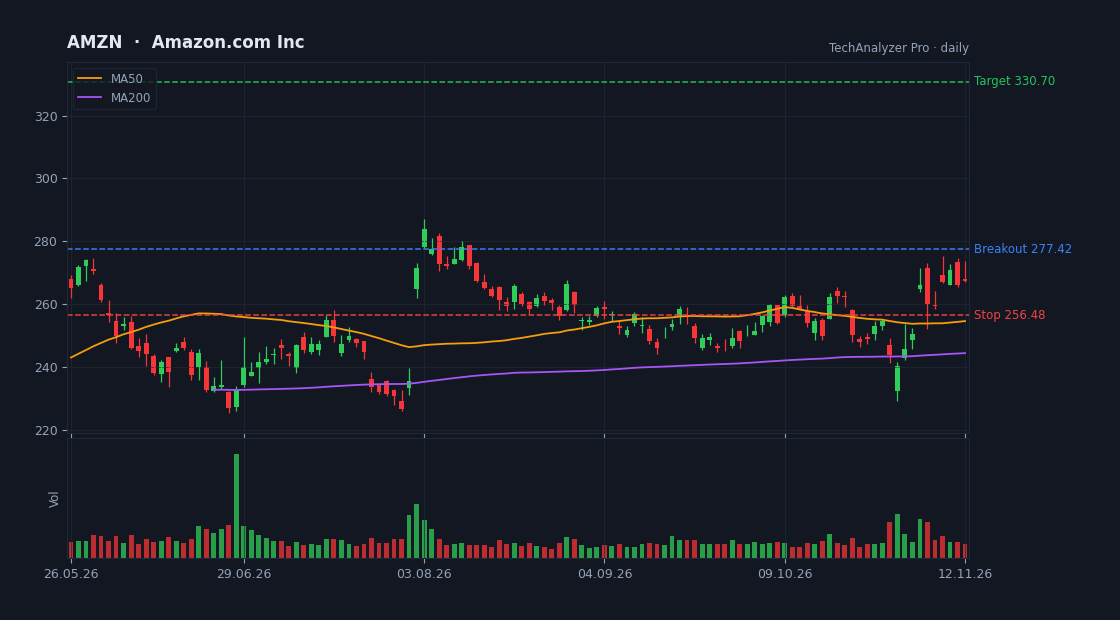
Trend Uptrend | RSI (14) 58 | ATR (14) 9.3079 |
Breakout level 277.42 | Technical target 330.70 | Invalidation (ATR) 256.48 |
The structure on the chart
Amazon.com Inc (AMZN) was trading around $267.44 at the time of this issue, about 3.0% below a resistance zone near $275. The pattern the engine identified: ascending triangle.
Trend and momentum
The daily trend is up. Price was above all four moving averages we track (20, 50, 150 and 200 days). RSI at 58 was not at an extreme, which leaves room to move.
Volume and liquidity
The stock has an average daily dollar volume of about $13 billion and a market cap of about $2.9 trillion, liquid enough that even larger orders face a negligible bid-ask spread.
What would confirm a breakout
A daily close above the $275 zone on above-average volume, followed by a retest of the level from above that holds. An intraday pop that closes back below the level is not a breakout.
What would cancel the setup
A daily close below the low of the consolidation, a low-volume breakout that fails to hold for two days, or the broad market slipping below its 200-day average. If that happens, the setup is simply off.
What happened to last week's pick
Visa Inc. Class A (V): not triggered yet: the breakout level has not been reached, so the setup is still open. Read that issue.
This is a setup, not a forecast: the price may never break out, and a breakout does not guarantee the target.
Before the Breakout: one stock a week, by email
Every Friday morning: one US stock with a market cap above $5 billion that is consolidating just below resistance, explained in plain English, plus what happened to last week's pick, even when it didn't work.
Free. Unsubscribe in one click. Not investment advice.