 TechAnalyzer Pro
Illumina Inc (ILMN) daily technical analysis
Automated daily analysis of Illumina Inc as of the 2026-11-02 candle. Updated 2026-11-03, every trading day.
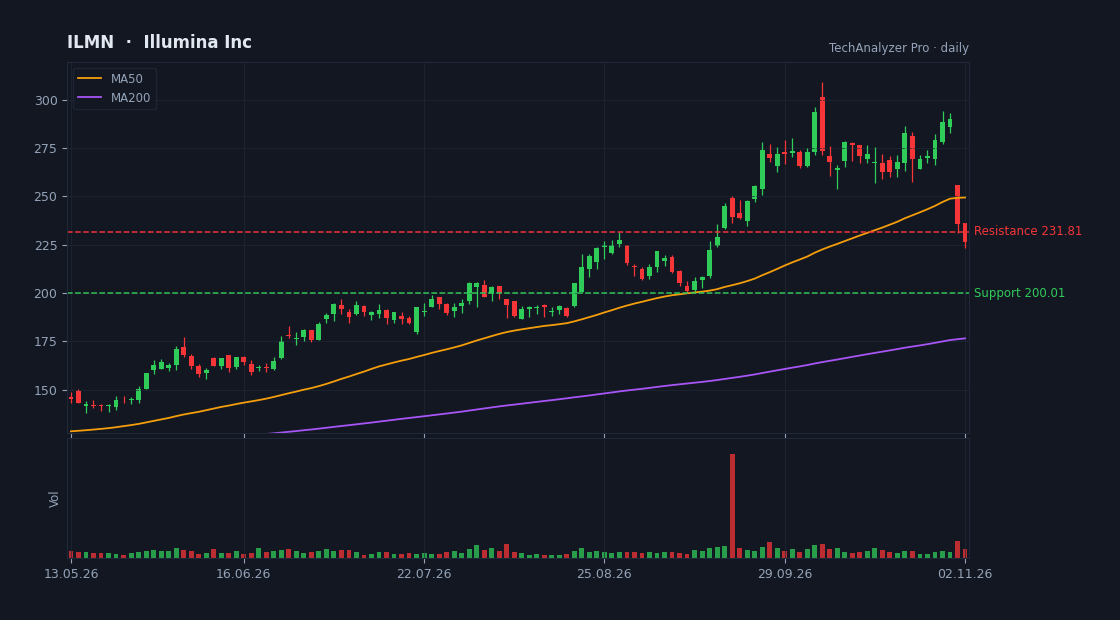
Illumina Inc at a glance
Illumina Inc (ILMN) daily technical analysis for 2026-11-02. Last price 226.58 (-3.99% on the day). The trend is up and RSI(14) is 36. Price is -9.2% from the 50-day and +28.4% from the 200-day moving average. Long-term uptrend, with price in a pullback below the 20- and 50-day averages. There is no active setup right now. Technical information only, not investment advice.
Price is 26.8% below the 52-week high (309.35) and 101.1% above the 52-week low (112.65). Performance: 1 month -17.0%, 3 months +11.6%, 1 year +128.8%. Average daily range (ATR-14) is 7.4% of the price.
Latest technical setup
There is no active setup right now. The engine requires structure, reward-to-risk and a supportive market regime before it grades a setup.
Patterns, levels that update with every candle, and the setup's entry, stop and target.
Open ILMN in the app — no sign-upThe latest quarterly report in plain English
Quarter ended September 30, 2026, filed October 30, 2026. Facts from the structured filing, not commentary and not a recommendation.
In the quarter ended September 30, 2026, Illumina Inc brought in $1.1 billion in revenue.
Net income was $220 million: out of every $100 in revenue, 20 was left as profit (18 the quarter before).
Out of every $100 in sales, 74 was left after the cost of the product (gross profit), compared with 66 in the previous quarter.
After investments, $378 million of free cash actually came in.
Cash on hand: $1.3 billion, against debt of $2.3 billion (net debt of $976 million).
| September 30, 2026 | Previous quarter | Year ago | |
|---|---|---|---|
| Revenue | $1.1 billion | $1.2 billion | $1.1 billion |
| Net income | $220 million | $207 million | $150 million |
| Free cash flow | $378 million | $161 million | $260 million |
| Cash | $1.3 billion | $1.2 billion | $1.3 billion |
About Illumina Inc
Illumina, Inc. provides sequencing- and array-based solutions for genetic and genomic analysis in the Americas, Europe, Greater China, the Asia Pacific, the Middle East, and Africa. The company offers sequencing- and array-based instruments and consumables, which include reagents, flow cells, and li…
ILMN FAQ
What is the trend of ILMN?
The daily trend of Illumina Inc is classified as uptrend, with weakening momentum. Price is -9.2% from its 50-day moving average and +28.4% from its 200-day. Long-term uptrend, with price in a pullback below the 20- and 50-day averages. The trend is computed by fixed rules: price vs. the 50- and 200-day averages, the 50-day slope, 50 vs. 200, and the swing structure. Momentum (short averages, MACD and RSI) measures the pace and can fade inside an uptrend.
What is the RSI of ILMN?
RSI(14) is 36, in the middle of the range — not at an extreme.
Where are the support and resistance levels of ILMN?
On the daily chart the nearest support is 200.01 (touched once) and the nearest resistance is 231.81 (touched 2 times). Levels are detected automatically from swing points and update with every candle.
How far is ILMN from its 52-week high?
The 52-week high is 309.35 and the current price is 26.8% below it. Distance from the high is context, not a signal.
Is there a buy or sell recommendation for ILMN?
No. This page gives no buy or sell recommendations and is not investment advice. It shows automated, rule-based technical analysis — trend, support and resistance, indicators and volume — to save research time. The decision and the verification are yours.
More: all stock analyses · technical analysis guides · pricing · ILMN in plain English: fundamentals, news and what to watch · embed the ILMN analysis on your site — free widget