 TechAnalyzer Pro
Monday.Com Ltd MNDY
Stock research in plain language · As of Oct 12, 2026 · updated once a week, after the trading week closes
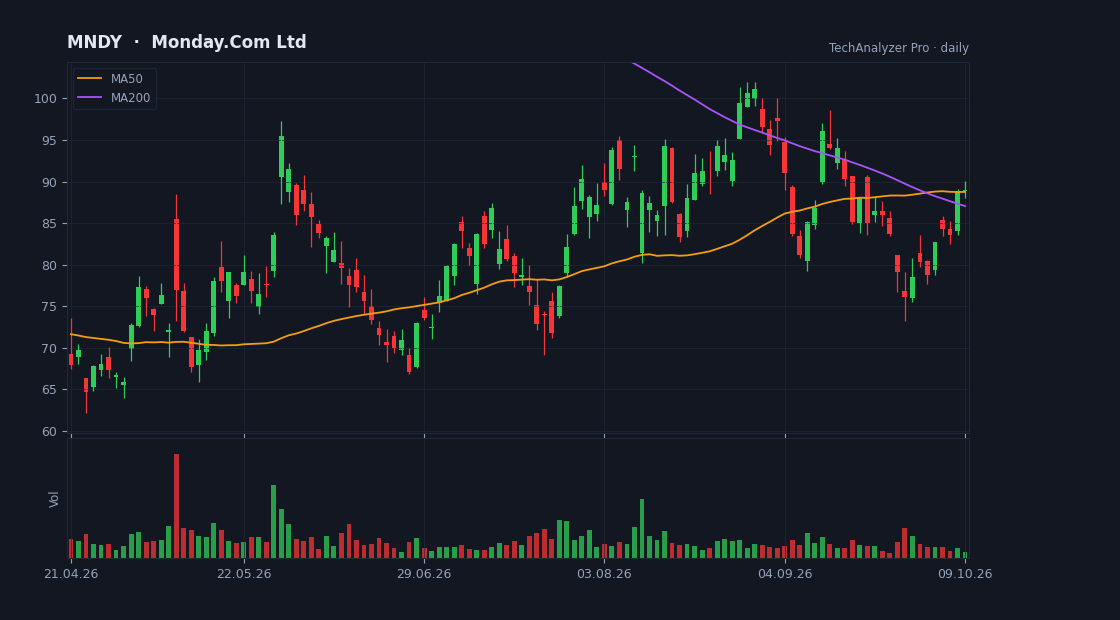
Daily candles, 50 and 200-day averages and volume · updated every trading day · click to open the live chart
What the company does
Monday.Com Ltd is a mid-cap company in the Technology sector (Software - Application), with a market value of $3.8B, based in the USA.
It employs about 3,155 people and has been listed since Jun 10, 2021.
monday.com Ltd., together with its subsidiaries, develops software applications in the United States, Europe, the Middle East, Africa, the United Kingdom, and internationally. The company provides Work Operating System (Work OS), a cloud-based visual work OS that consists of modular building blocks used and assembled to create software applications and work management tools. Its products include monday work management that manages workflows, projects, and portfolios for team collaboration and productivity; monday CRM, which tracks and manages various sales cycle; monday dev that builds agile product and software development workflows; monday service, which creates seamless connection between service desks and their data; WorkCanvas, a digital whiteboard; and WorkForms, which allows users to create personalized forms or surveys and gain organizational insights.
Cheap or expensive? priced in line with its group
Its price-to-earnings (P/E) is 37.5 versus 43.5 for the median of the Technology sector in our universe (65 companies) — priced in line with its group.
Revenue is growing 22% versus the same quarter last year.
On analysts' next-year forecasts the multiple drops to 11.9 — they expect higher earnings.
The average analyst price target is 108.87, 22% above the current price (their view, not ours).
The stock sits at 21% of its one-year range (0% = the low, 100% = the high).
The risks
- • The stock is more volatile than average (beta 1.1) — big daily moves both ways.
- • 17% of the float is sold short — part of the market is betting on a decline.
- • The stock is 58% below its one-year high.
Strengths
- ✅ Profitable — 1 of every 100 dollars of revenue stays as profit.
- ✅ Generates free cash flow — profit becomes cash in the bank.
- ✅ Buys back its shares (17% fewer shares in a year).
- ✅ More cash than debt.
- ✅ Most analysts rate it buy (15 vs 0).
- ✅ Revenue is growing 22% a year.
What changed this week
Over the past week the stock rose 12.9% (for comparison: S&P 500 +1.2%, sector ETF XLK -0.5%).
No notable news about the company was found in the past week.
What changed since last week
This is the first summary for this stock; from next week this section shows what changed.
A description of facts from the filings and the market — not investment advice or a recommendation. "Cheap" and "expensive" are always relative to the comparison group.