 TechAnalyzer Pro
Exxon Mobil Corp XOM
Stock research in plain language · As of Oct 25, 2026 · updated once a week, after the trading week closes
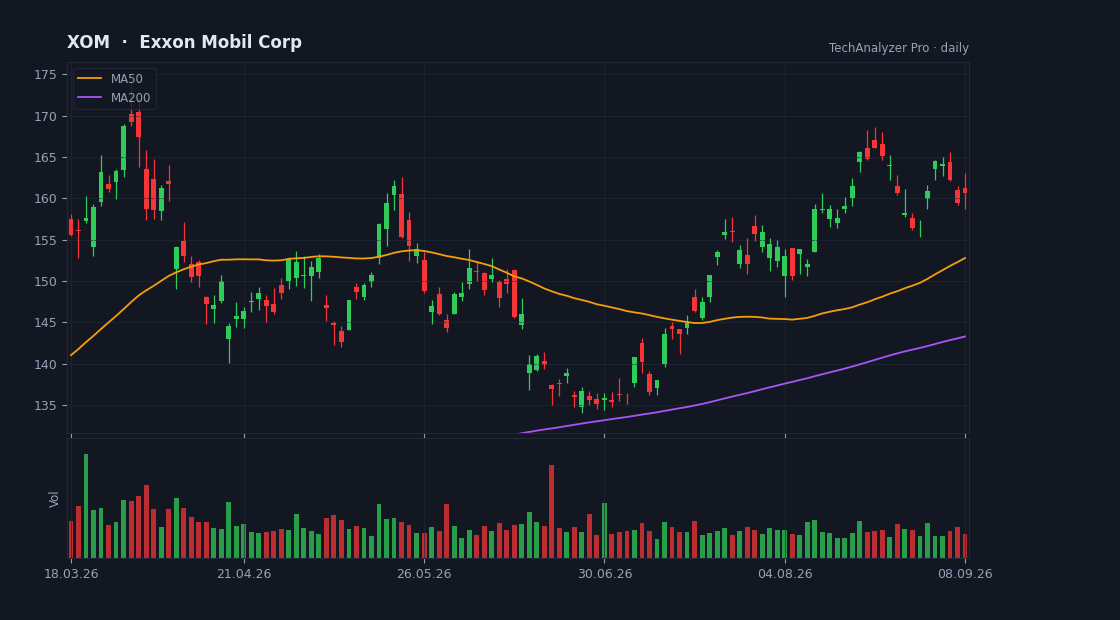
Daily candles, 50 and 200-day averages and volume · updated every trading day · click to open the live chart
The bottom line
What moves this stock now is the oil price: the articles describe crude at a five-month high and geopolitical tension, and the shares rose 2.36% on the week versus -0.43% for the S&P 500, touching a 52-week high. Our data shows 44.1% year-over-year revenue growth and $17.0 billion of quarterly free cash flow, but last quarter's EPS was $3.52 against a $3.68 estimate. At $183.21 the stock sits above the average analyst target of $179.41 and trades at 22.93 earnings multiple versus a 21.2 peer median, meaning high oil prices are already priced in. The central tension: the current price level rests on crude staying elevated, something the company does not control.
An explanation of the mechanics from the facts on this page, not advice.
What the company does
Exxon Mobil Corp is a mega-cap company in the Energy sector (Oil & Gas Integrated), with a market value of $753.3B, based in the USA.
It employs about 57,900 people and has been listed since Jan 13, 1978.
ExxonMobil Holdings Corporation engages in the exploration and production of crude oil and natural gas in the United States, Canada, and internationally. The company operates through Upstream, Energy Products, Chemical Products, and Specialty Products segments. Its Upstream segment explores for and produces crude oil and natural gas.
Cheap or expensive? priced in line with its group
Its price-to-earnings (P/E) is 22.9 versus 21.2 for 4 direct peers — priced in line with its group.
Revenue is growing 44% versus the same quarter last year.
On analysts' next-year forecasts the multiple drops to 15.0 — they expect higher earnings.
The average analyst price target is 179.41, 2% below the current price (their view, not ours).
The stock sits at 99% of its one-year range (0% = the low, 100% = the high).
The risks
- • Quarterly report in 5 days (2026-10-30) — a day the stock can move a lot.
Strengths
- ✅ Profitable — 13 of every 100 dollars of revenue stays as profit.
- ✅ Generates free cash flow — profit becomes cash in the bank.
- ✅ Buys back its shares (4% fewer shares in a year).
- ✅ Most analysts rate it buy (9 vs 0).
- ✅ Revenue is growing 44% a year.
- ✅ Pays a dividend (2.3% a year).
What the market is talking about this week
Expensive oil pushes Exxon to a yearly high, days before a quarterly report with raised expectations.
- Exxon Mobil reports quarterly results on October 30, 2026; analysts expect earnings of $3.96 per share and revenue of $102.74 billion. [2] [5]
- The quarterly earnings estimate was raised 18.67% over the past 30 days, per Zacks, which rates the stock 'Strong Buy'. [2] [5]
- The stock trades near a 52-week high, supported by rising oil prices driven by Middle East tensions. [2] [3] [4]
- Per Zacks, the stock trades at a 13.08 forward P/E versus an industry average of 7.69 — expensive relative to the industry. [2]
- A comparison piece pits Exxon against Chevron, both near yearly highs, examining production, cash generation and shareholder returns. [4]
A summary of the articles below only, each point with its source. Not a forecast, not a recommendation.
What to watch
- The quarterly report on October 30, 2026 — consensus is $3.96 per share, after last quarter came in below estimates. (2026-10-30) [2] [5]
- Whether revenue reaches the $102.74 billion analysts expect, compared with $114.5 billion last quarter. (2026-10-30) [5]
- Oil prices themselves — the articles tie the stock's rise to crude at highs and Middle East tension. [3] [4] [6]
- Free cash flow and buybacks in the upcoming report, the source of shareholder returns. (2026-10-30)
What changed this week
Over the past week the stock rose 2.4% (for comparison: S&P 500 -0.4%, sector ETF XLE +1.6%).
It set a new one-year high this week.
This week's news
- 3 Oil Stocks With Earnings Growth Over 5% finance.yahoo.com · 2026-10-24
A roundup of three oil stocks with over 5% earnings growth as crude hits a five-month high; it covers Chevron and Ovintiv, not Exxon. source ↗ - Exxon Mobil Holdings (XOM) Gains As Market Dips: What You Should Know finance.yahoo.com · 2026-10-23
Exxon closed at $183.21, up 2.79% on a day the S&P 500 fell; earnings due Oct 30, estimate $3.96 EPS, forward P/E 13.08. source ↗ - Investing.com’s stocks of the week finance.yahoo.com · 2026-10-23
Investing.com's weekly stock roundup: cybersecurity names rose, Meta fell 9.1%, and Middle East escalation pushed crude to highs. source ↗ - Chevron vs. ExxonMobil: Which Stock Has the Edge at 52-Week Highs? finance.yahoo.com · 2026-10-23
A Chevron-versus-Exxon comparison with both near 52-week highs; Brent above $110, detailing Chevron's production, cash flow and dividend. source ↗ - Exxon Mobil Holdings (XOM) Reports Next Week: Wall Street Expects Earnings Growth finance.yahoo.com · 2026-10-23
A preview of Exxon's Oct 30 report: expected EPS of $3.96 (+110.6%) and revenue of $102.74 billion (+20.5%), with estimates revised up 18.67%. source ↗ - Can Baker Hughes Keep Its Winning Streak Alive in Q3 Earnings? finance.yahoo.com · 2026-10-23
A preview of Baker Hughes' Oct 27 report; September 2026 WTI averaged $97.31 per barrel versus $63.96 a year earlier. source ↗
What changed since last week
• New risk flag: earnings report coming up.
• The price rose 3.5% since the last summary.
• The average analyst target moved from 173.64 to 179.41.
A description of facts from the filings and the market — not investment advice or a recommendation. "Cheap" and "expensive" are always relative to the comparison group. Educational information only — not investment advice. Not a registered investment adviser or broker-dealer.