 TechAnalyzer Pro
Workday Inc WDAY
Stock research in plain language · As of Oct 25, 2026 · updated once a week, after the trading week closes
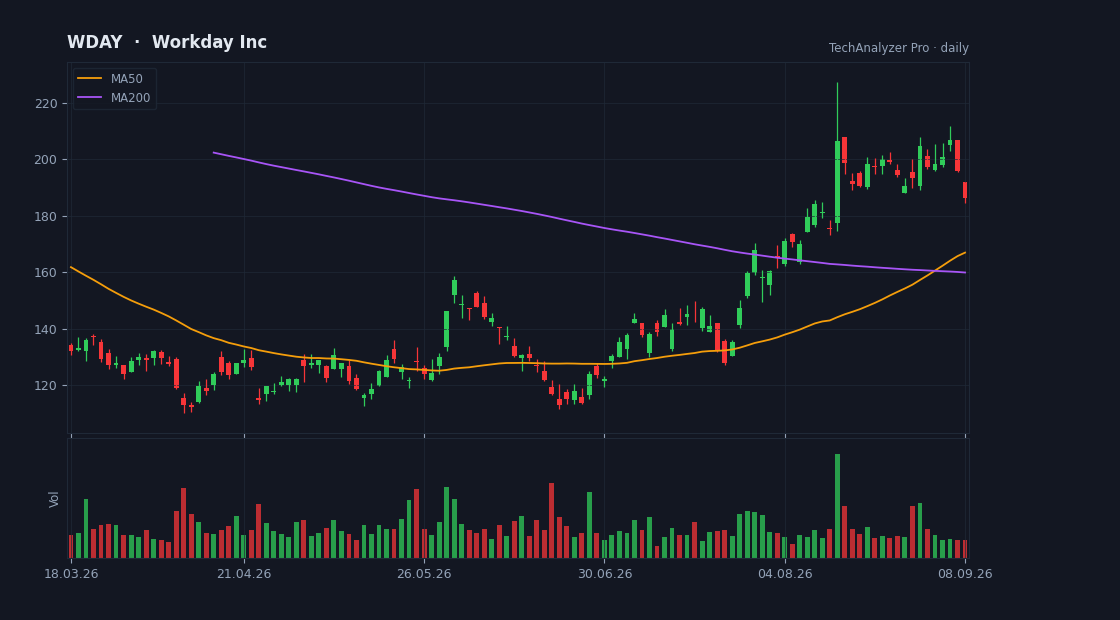
Daily candles, 50 and 200-day averages and volume · updated every trading day · click to open the live chart
What the company does
Workday Inc is a large-cap company in the Technology sector (Software - Application), with a market value of $50.6B, based in the USA.
It employs about 20,896 people and has been listed since Oct 12, 2012.
Workday, Inc. provides enterprise cloud applications in the United States and internationally. The company offers a suite of financial management applications to maintain accounting information; manage financial processes, such as payables and receivables; identify real-time financial, operational, and management insights; perform financial consolidation; reduce time-to-close; promote internal control and auditability; and achieve consistency across finance operations.
Cheap or expensive? priced in line with its group
Its price-to-earnings (P/E) is 42.8 versus 38.7 for the median of the Technology sector in our universe (65 companies) — priced in line with its group.
Revenue is growing 13% versus the same quarter last year.
On analysts' next-year forecasts the multiple drops to 15.1 — they expect higher earnings.
The average analyst price target is 209.25, 0% below the current price (their view, not ours).
The stock sits at 74% of its one-year range (0% = the low, 100% = the high).
The risks
- No risk flags were detected from the data we have.
Strengths
- ✅ Profitable — 24 of every 100 dollars of revenue stays as profit.
- ✅ Generates free cash flow — profit becomes cash in the bank.
- ✅ Buys back its shares (7% fewer shares in a year).
- ✅ Most analysts rate it buy (19 vs 3).
What changed this week
Over the past week the stock rose 10.1% (for comparison: S&P 500 -0.4%, sector ETF XLK -0.1%).
This week's news
- The AI Trade Is Shifting From Chip Stocks to Cybersecurity finance.yahoo.com · 2026-10-24
What the article says
Software leaders got a big boost this week and chip stocks were crushed as the AI tech investing landscape continues to shift. Continue Reading source ↗
- Workday (WDAY) Stock Looks Undervalued Based On Future Cash Flow finance.yahoo.com · 2026-10-23
What the article says
Workday, Inc. Workday stock has climbed to about US$209.99 after a mixed run that includes a sharp 5 year decline, so the immediate question for investors is whether that price still lines up with the cash the business is expected to generate. Over the past 5 years the share price has fallen 26.8%. This puts the focus… source ↗
- Workday prices $2.5B senior notes offering seekingalpha.com · 2026-10-22
What the article says
[Workday Headquarters Building] hapabapa * Workday (WDAY [https://seekingalpha.com/symbol/WDAY]) has priced its underwritten, registered public offering of $2.5 billion in aggregate principal amount of senior notes, according to a filing… source ↗
- Workday Announces Pricing of $2.5 Billion Senior Notes Offering finance.yahoo.com · 2026-10-22
What the article says
PLEASANTON, Calif., Oct. 21, 2026 /PRNewswire/ -- Workday, Inc. (NASDAQ: WDAY), the trusted agentic platform for HR, finance, and IT, today announced that it has priced its underwritten, registered public offering of $2.5 billion aggregate principal amount of senior notes, consisting of $750.0 million aggregate… source ↗
- ServiceNow (NOW) Needs Stronger Cash Flow to Support Its AI Expansion finance.yahoo.com · 2026-10-21
What the article says
ServiceNow, Inc. (NYSE:NOW) is winning more business as companies use AI to automate work, but growing its platform costs more. The stock trades at about 28 times forecast earnings. Can rising AI demand produce enough extra profit to justify that price? Companies Need AI That Can Complete the Work Businesses want AI… source ↗
- Will Workday's C1.ai Acquisition Boost Its Enterprise AI Position? finance.yahoo.com · 2026-10-21
What the article says
Workday, Inc. WDAY has announced a definitive agreement to acquire C1.ai, an agentic identity platform, to strengthen its artificial intelligence (AI)-driven enterprise offerings. The acquisition is expected to enhance Workday's ability to manage identity governance and access permissions for employees and AI agents… source ↗
What changed since last week
• The price rose 10.1% since the last summary.
A description of facts from the filings and the market — not investment advice or a recommendation. "Cheap" and "expensive" are always relative to the comparison group. Educational information only — not investment advice. Not a registered investment adviser or broker-dealer.