 TechAnalyzer Pro
Trade Desk Inc TTD
Stock research in plain language · As of Oct 25, 2026 · updated once a week, after the trading week closes
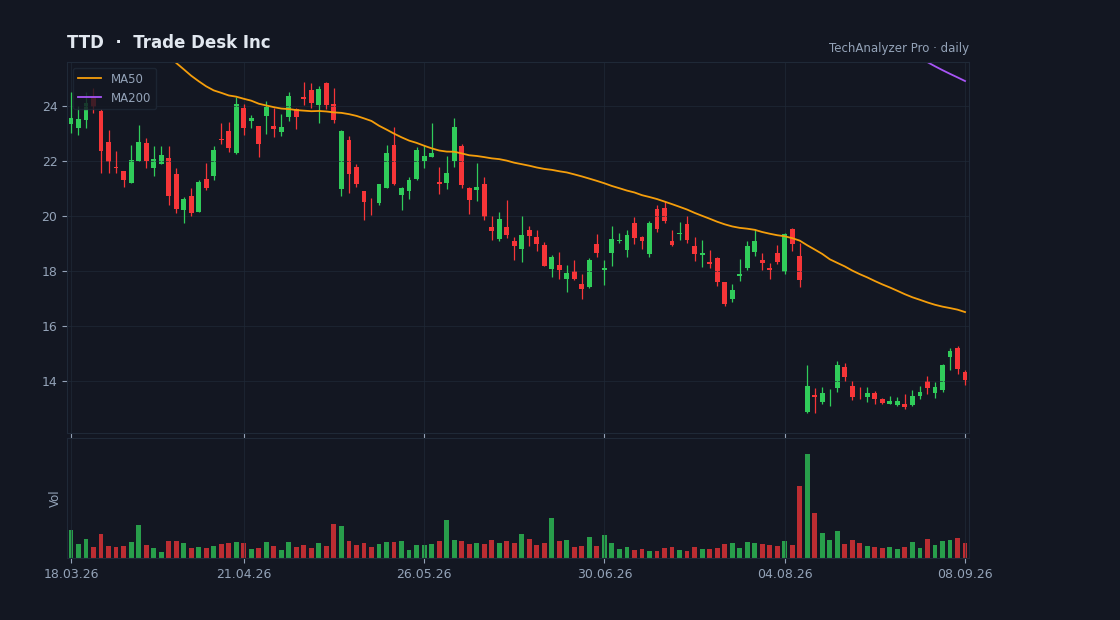
Daily candles, 50 and 200-day averages and volume · updated every trading day · click to open the live chart
What the company does
Trade Desk Inc is a mid-cap company in the Communication Services sector (Advertising Agencies), with a market value of $6.1B, based in the USA.
It employs about 3,843 people and has been listed since Sep 21, 2016.
The Trade Desk, Inc. operates as a technology company in the United States and internationally. The company creates, manages, and optimizes digital advertising campaigns across ad formats, channels and devices, including CTV and other video, display, audio, and native, on a multitude of devices, such televisions, streaming devices, mobile devices, computers and digital-out-of-home devices.
Cheap or expensive? priced in line with its group
Its price-to-earnings (P/E) is 15.7 versus 15.5 for the median of the Communication Services sector in our universe (18 companies) — priced in line with its group.
Revenue is growing 3% versus the same quarter last year.
On analysts' next-year forecasts the multiple rises to 38.0 — they expect lower earnings.
The average analyst price target is 13.53, 4% above the current price (their view, not ours).
The stock sits at 3% of its one-year range (0% = the low, 100% = the high).
The risks
- ⚠️ 22% of the float is sold short — part of the market is betting on a decline.
- • The stock is 76% below its one-year high.
- • Quarterly report in 11 days (2026-11-05) — a day the stock can move a lot.
- • More analysts rate it sell (8) than buy (5).
Strengths
- ✅ Profitable — 9 of every 100 dollars of revenue stays as profit.
- ✅ Generates free cash flow — profit becomes cash in the bank.
- ✅ Buys back its shares (5% fewer shares in a year).
- ✅ More cash than debt.
What changed this week
Over the past week the stock rose 6.3% (for comparison: S&P 500 -0.4%, sector ETF XLC -4.4%).
This week's news
- Advertising software stocks Q2 teardown: Zeta Global (NYSE:ZETA) vs the rest finance.yahoo.com · 2026-10-24
What the article says
Advertising software stocks Q2 teardown: Zeta Global (NYSE:ZETA) vs the rest As the Q2 earnings season comes to a close, it's time to take stock of this quarter's best and worst performers in the advertising software industry, including Zeta Global (NYSE:ZETA) and its peers. The digital advertising market is large,… source ↗
- Here's Why The Trade Desk (TTD) Fell More Than Broader Market finance.yahoo.com · 2026-10-23
What the article says
The Trade Desk (TTD) closed at $13.02 in the latest trading session, marking a -1.1% move from the prior day. This change lagged the S&P 500's 0.52% loss on the day. At the same time, the Dow lost 1.24%, and the tech-heavy Nasdaq lost 0.21%. The digital-advertising platform operator's shares have seen an increase of… source ↗
- Rowan Street Capital Exits The Trade Desk (TTD) as Thesis Breaks finance.yahoo.com · 2026-10-22
What the article says
Rowan Street Capital, an investment management company, released its Q3 2026 investor letter. The letter can be downloaded here. After a challenging start to the year, the portfolio mounted a meaningful recovery, gaining 11% in Q3 to reduce its YTD decline to 12% as of September 30. Led by strong contributions from… source ↗
- The Trade Desk (TTD) is Attracting Investor Attention: Here is What You Should Know finance.yahoo.com · 2026-10-21
What the article says
The Trade Desk (TTD) is one of the stocks most watched by Zacks.com visitors lately. So, it might be a good idea to review some of the factors that might affect the near-term performance of the stock. Shares of this digital-advertising platform operator have returned -4% over the past month versus the Zacks S&P 500… source ↗
- Asana, Appian, Five9, Sprout Social, and The Trade Desk Stocks Trade Up, What You Need To Know finance.yahoo.com · 2026-10-20
What the article says
Asana, Appian, Five9, Sprout Social, and The Trade Desk Stocks Trade Up, What You Need To Know What Happened? A number of stocks jumped in the afternoon session after software stocks extended gains as the broader stock market undergoes an overhaul regarding the future of the artificial intelligence trade. Repricing… source ↗
- How Customer Hesitancy Will Impact Trade Desk Stock Investors finance.yahoo.com · 2026-10-20
What the article says
The Trade Desk recently reported softer billings trends, guided to lower future revenue and increased capital needs, and reorganized operations with a 15% workforce reduction. These updates point to customer hesitancy and rising cost intensity at The Trade Desk, raising questions about how scalable its current model… source ↗
What changed since last week
• New risk flag: earnings report coming up.
• Risk flag cleared: high volatility.
• The price rose 6.3% since the last summary.
A description of facts from the filings and the market — not investment advice or a recommendation. "Cheap" and "expensive" are always relative to the comparison group. Educational information only — not investment advice. Not a registered investment adviser or broker-dealer.