 TechAnalyzer Pro
T-Mobile US Inc TMUS
Stock research in plain language · As of Oct 25, 2026 · updated once a week, after the trading week closes
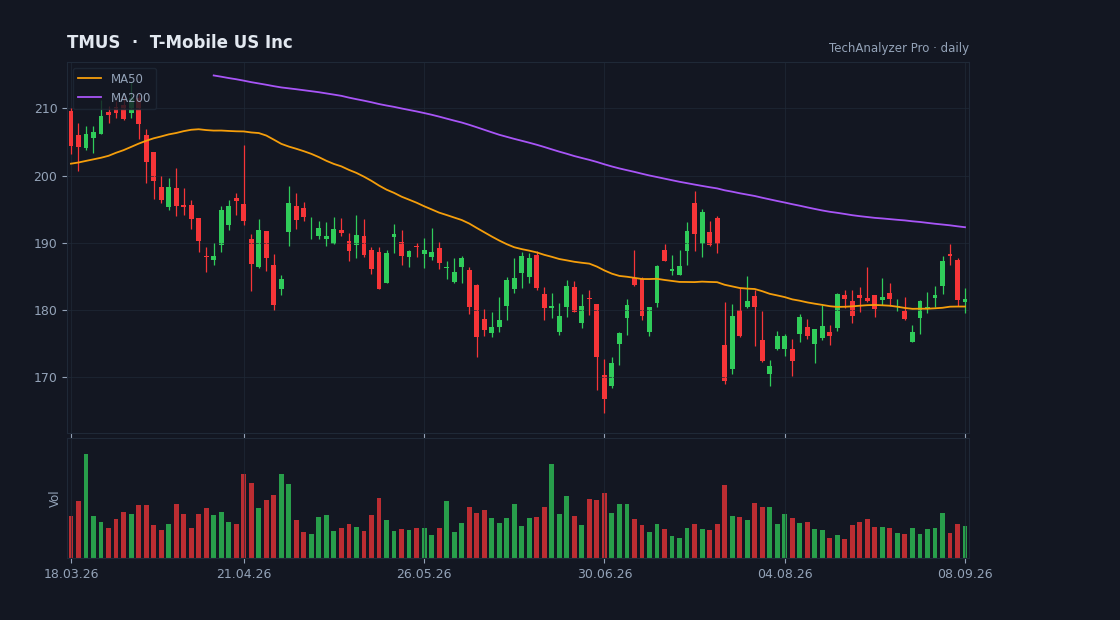
Daily candles, 50 and 200-day averages and volume · updated every trading day · click to open the live chart
What the company does
T-Mobile US Inc is a large-cap company in the Communication Services sector (Telecom Services), with a market value of $157.2B, based in the USA.
It employs about 75,000 people and has been listed since Apr 19, 2007.
T-Mobile US, Inc., together with its subsidiaries, provides wireless communications services in the United States, Puerto Rico, and the United States Virgin Islands. The company offers voice, messaging, and data services to postpaid, prepaid, and wholesale and other services customers. It also provides wireless devices, including smartphones, wearables, tablets, home broadband gateways, headsets, and other mobile communication devices, as well as accessories; financing through equipment installment plans; reinsurance for device insurance policies and extended warranty contracts.
Cheap or expensive? priced in line with its group
Its price-to-earnings (P/E) is 15.3 versus 11.6 for 3 direct peers — priced in line with its group.
Revenue is growing 8% versus the same quarter last year.
On analysts' next-year forecasts the multiple rises to 17.8 — they expect lower earnings.
The average analyst price target is 236.84, 62% above the current price (their view, not ours).
The stock sits at 0% of its one-year range (0% = the low, 100% = the high).
The risks
- • Net debt is 2.0× shareholders' equity — high leverage.
- • The stock is 34% below its one-year high.
- • Quarterly report in 3 days (2026-10-28) — a day the stock can move a lot.
Strengths
- ✅ Profitable — 14 of every 100 dollars of revenue stays as profit.
- ✅ Generates free cash flow — profit becomes cash in the bank.
- ✅ Buys back its shares (5% fewer shares in a year).
- ✅ Most analysts rate it buy (24 vs 0).
- ✅ Pays a dividend (2.6% a year).
What changed this week
Over the past week the stock fell 7.9% (for comparison: S&P 500 -0.4%, sector ETF XLC -4.4%).
It set a new one-year low this week.
This week's news
- 5 out of 5 communications services stocks deliver EPS wins this week: Earnings Scorecard seekingalpha.com · 2026-10-24
What the article says
Communications services stocks grabbed the spotlight this week as Wall Street digested earnings reports from major names, including Netflix (NFLX [https://seekingalpha.com/symbol/NFLX]) and Meta Platforms (META [https://seekingalpha.com/symbol/META]). The communications services sector (XLC… source ↗
- 'It's not something that gets done overnight': SpaceX's telecom ambitions will be hard-won, CEOs and analysts say finance.yahoo.com · 2026-10-24
What the article says
Elon Musk wants SpaceX (SPCX) to take on America's largest cell service providers, but matching the telecom giants' vast wireless networks could take years and billions of dollars, executives and analysts warned this week. SpaceX, which already operates the world's largest commercial satellite network with Starlink,… source ↗
- Semtech Brings 5G Network Slicing, FIPS 140-3 to IACP 2026 finance.yahoo.com · 2026-10-24
What the article says
AirLink 5G Solutions Keep First Responders Connected During Peak Network Demand CAMARILLO, Calif., October 24, 2026--(BUSINESS WIRE)--Semtech Corporation (Nasdaq: SMTC), a leading provider of high-performance semiconductors powering AI data center networking and intelligent, connected Internet of Things ("IoT")… source ↗
- T-Mobile promised to 'never change the price you pay' — then hiked rates. New Yorkers just got back $38M in value finance.yahoo.com · 2026-10-24
What the article says
Jeff Greenberg /Getty Images A $5 price hike in 2024 will cost T-Mobile (NASDAQ:TMUS) a "reimbursement" agreement of "$38 million in value" for New York customers, state Attorney General Letitia James' office announced on Oct. 20. And it all stems from T-Mobile's pledge to 4G customers to "never change the price you… source ↗
- SpaceX wants to be America's fourth phone carrier — tower owners are cashing in finance.yahoo.com · 2026-10-23
What the article says
SpaceX wants to be America's fourth phone carrier — tower owners are cashing in Elon Musk's SpaceX doesn't just want to beam the internet from space. It wants to sell you a phone plan, and the companies that own the cell towers are already cashing in. SpaceX (SPCX) is in talks for access to at least 80,000 US cell… source ↗
- Starlink Is Years Away From Competing With AT&T and Verizon, Citi Says—but It Might Move Faster finance.yahoo.com · 2026-10-23
What the article says
Citi sees SpaceX launching national wireless service no earlier than 2029, but its reported interest in 80,000 cell sites raises questions about that timeline. Continue Reading source ↗
What changed since last week
• Valuation moved from "relatively expensive" to "priced in line with its group".
• New risk flag: deep drawdown from the high.
• The price fell 7.9% since the last summary.
A description of facts from the filings and the market — not investment advice or a recommendation. "Cheap" and "expensive" are always relative to the comparison group. Educational information only — not investment advice. Not a registered investment adviser or broker-dealer.