 TechAnalyzer Pro
AT&T Inc. T
Stock research in plain language · As of Oct 25, 2026 · updated once a week, after the trading week closes
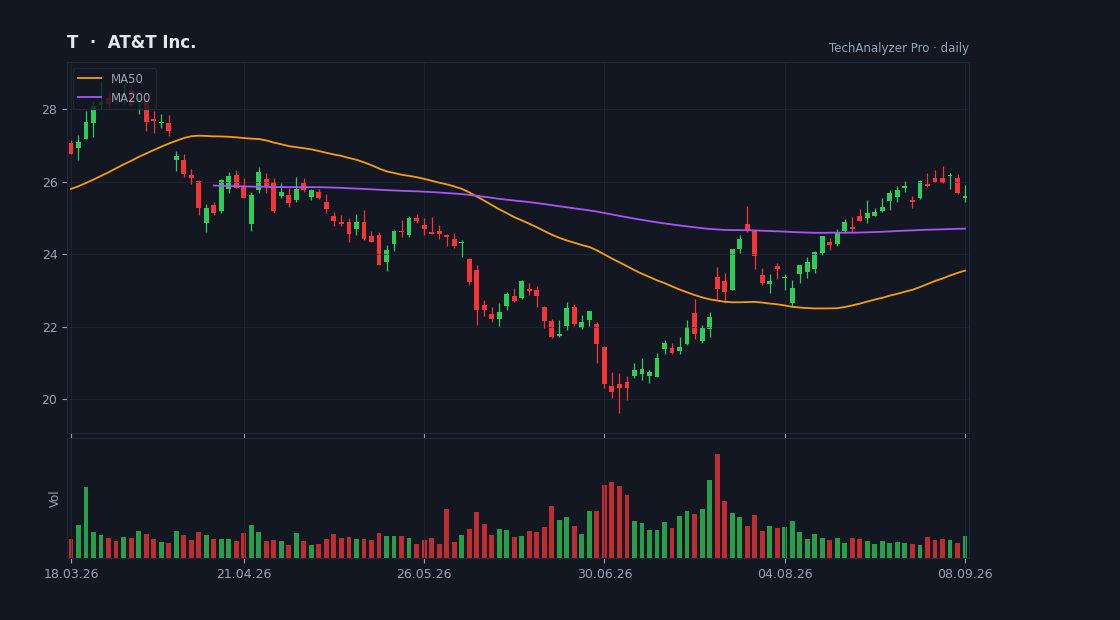
Daily candles, 50 and 200-day averages and volume · updated every trading day · click to open the live chart
What the company does
AT&T Inc. is a large-cap company in the Communication Services sector (Telecom Services), with a market value of $141.0B, based in the USA.
It employs about 133,030 people and has been listed since Jul 19, 1984.
AT&T Inc. provides telecommunications and technology services worldwide. It operates through two segments, Communications and Latin America.
Cheap or expensive? priced in line with its group
Its price-to-earnings (P/E) is 12.2 versus 11.6 for 3 direct peers — priced in line with its group.
Revenue is growing 5% versus the same quarter last year.
On analysts' next-year forecasts the multiple drops to 10.1 — they expect higher earnings.
The average analyst price target is 27.80, 33% above the current price (their view, not ours).
The stock sits at 17% of its one-year range (0% = the low, 100% = the high).
The risks
- • Net debt is 1.6× shareholders' equity — high leverage.
Strengths
- ✅ Profitable — 3 of every 100 dollars of revenue stays as profit.
- ✅ Generates free cash flow — profit becomes cash in the bank.
- ✅ Buys back its shares (4% fewer shares in a year).
- ✅ Most analysts rate it buy (14 vs 1).
- ✅ Pays a dividend (4.9% a year).
What changed this week
Over the past week the stock fell 10.7% (for comparison: S&P 500 -0.4%, sector ETF XLC -4.4%).
The company published its quarterly report this week — see the plain-language summary above.
This week's news
- Earnings Scoreboard: 82% firms beat EPS estimates, 79% post Y/Y earnings growth seekingalpha.com · 2026-10-24
What the article says
[Top view image of text THIRD QUARTER on office desk.] mohd izzuan Earnings season gathered momentum during the last week, with 76 S&P 500 companies reporting results across key sectors, including Financials, Communication Services, Consumer Discretionary, Industrials, and Energy. The results offered a fresh look at… source ↗
- 5 out of 5 communications services stocks deliver EPS wins this week: Earnings Scorecard seekingalpha.com · 2026-10-24
What the article says
Communications services stocks grabbed the spotlight this week as Wall Street digested earnings reports from major names, including Netflix (NFLX [https://seekingalpha.com/symbol/NFLX]) and Meta Platforms (META [https://seekingalpha.com/symbol/META]). The communications services sector (XLC… source ↗
- 'It's not something that gets done overnight': SpaceX's telecom ambitions will be hard-won, CEOs and analysts say finance.yahoo.com · 2026-10-24
What the article says
Elon Musk wants SpaceX (SPCX) to take on America's largest cell service providers, but matching the telecom giants' vast wireless networks could take years and billions of dollars, executives and analysts warned this week. SpaceX, which already operates the world's largest commercial satellite network with Starlink,… source ↗
- Midday Pulse: S&P 500 top intraday losers seekingalpha.com · 2026-10-23
What the article says
[Wall Street sign in Lower Manhattan, NYC] georgeclerk Here's a quick look at the stocks seeing the steepest intraday declines across the S&P 500 (SP500 [https://seekingalpha.com/symbol/SP500]) on Friday. Wall Street's major averages were mixed on Friday, while technology stocks continued to lag amid artificial… source ↗
- SpaceX wants to be America's fourth phone carrier — tower owners are cashing in finance.yahoo.com · 2026-10-23
What the article says
SpaceX wants to be America's fourth phone carrier — tower owners are cashing in Elon Musk's SpaceX doesn't just want to beam the internet from space. It wants to sell you a phone plan, and the companies that own the cell towers are already cashing in. SpaceX (SPCX) is in talks for access to at least 80,000 US cell… source ↗
- Starlink Is Years Away From Competing With AT&T and Verizon, Citi Says—but It Might Move Faster finance.yahoo.com · 2026-10-23
What the article says
Citi sees SpaceX launching national wireless service no earlier than 2029, but its reported interest in 80,000 cell sites raises questions about that timeline. Continue Reading source ↗
What changed since last week
• Valuation moved from "relatively cheap" to "priced in line with its group".
• Risk flag cleared: earnings report coming up.
• The price fell 10.7% since the last summary.
• The average analyst target moved from 28.76 to 27.80.
• A new quarterly report was published (quarter ended Sep 30, 2026).
A description of facts from the filings and the market — not investment advice or a recommendation. "Cheap" and "expensive" are always relative to the comparison group. Educational information only — not investment advice. Not a registered investment adviser or broker-dealer.