 TechAnalyzer Pro
Southern Company SO
Stock research in plain language · As of Oct 25, 2026 · updated once a week, after the trading week closes
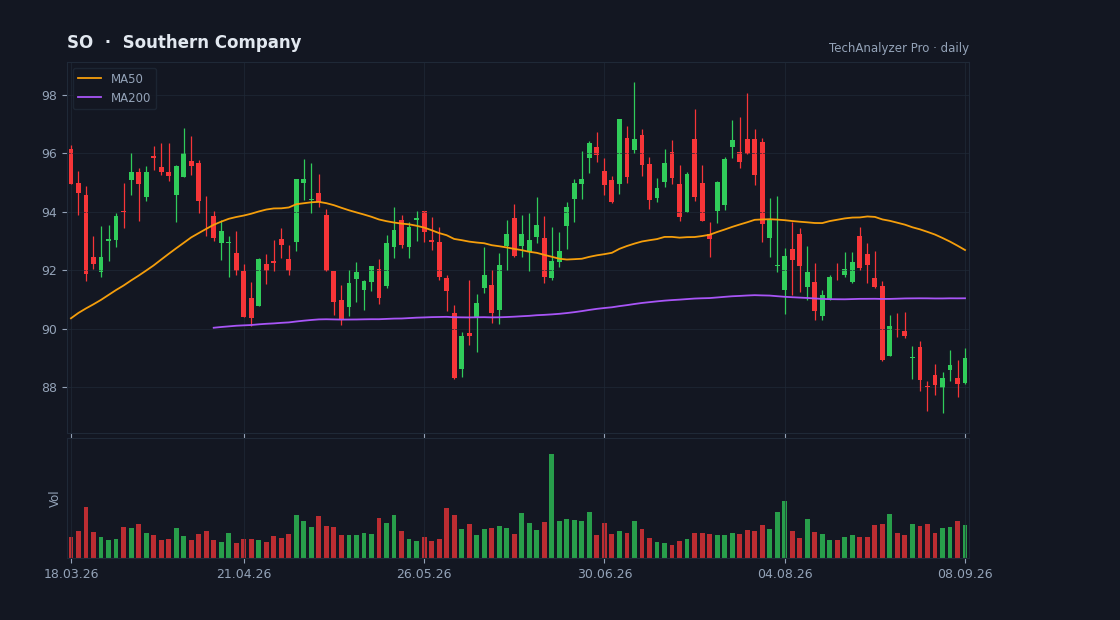
Daily candles, 50 and 200-day averages and volume · updated every trading day · click to open the live chart
What the company does
Southern Company is a large-cap company in the Utilities sector (Utilities - Regulated Electric), with a market value of $106.9B, based in the USA.
It employs about 29,502 people and has been listed since Dec 31, 1981.
The Southern Company, through its subsidiaries, engages in the sale of electricity. The company offers electric service to retail customers and wholesale customers; and energy-related products and services to natural gas choice markets. It also develops, constructs, acquires, owns, operates, and manages power generation assets, as well as battery energy storage projects; sells electricity at market-based rates in the wholesale market; and deploys microgrids for commercial, industrial, governmental, and utility customers.
Cheap or expensive? priced in line with its group
Its price-to-earnings (P/E) is 22.4 versus 22.4 for the median of the Utilities sector in our universe (9 companies) — priced in line with its group.
Revenue is growing 0% versus the same quarter last year.
On analysts' next-year forecasts the multiple drops to 17.3 — they expect higher earnings.
The average analyst price target is 96.05, 3% above the current price (their view, not ours).
The stock sits at 67% of its one-year range (0% = the low, 100% = the high).
The risks
- • Net debt is 1.9× shareholders' equity — high leverage.
- • Quarterly report in 11 days (2026-11-05) — a day the stock can move a lot.
Strengths
- ✅ Profitable — 17 of every 100 dollars of revenue stays as profit.
- ✅ Generates free cash flow — profit becomes cash in the bank.
- ✅ Pays a dividend (3.2% a year).
What changed this week
Over the past week the stock rose 1.9% (for comparison: S&P 500 -0.4%, sector ETF XLU +0.8%).
This week's news
- Southern (SO) Stock Looks About Right As DOE Backs Nuclear Experiment finance.yahoo.com · 2026-10-24
What the article says
Southern has delivered strong long term gains for shareholders, yet the recent share price around US$92.89 raises a simple question for you as an investor: Is the current valuation still anchored in the utility group's earnings power, or has sentiment moved ahead of what the business is actually generating? Southern… source ↗
- XCF Global (NASDAQ:SAFX) Outlines Strategy to Scale, Integrate and Deliver Following Completion of Business Combination finance.yahoo.com · 2026-10-23
What the article says
Combined platform brings renewable-fuel production, feedstock and fuel technology, and carbon solutions together under XCF Global. HOUSTON, TX / ACCESS Newswire / October 23, 2026 / XCF Global Inc. ("XCF" or the "Company") (NASDAQ:SAFX), a U.S.-based renewable fuels company, today outlined its strategy to scale its… source ↗
- Mississippi Power Names Jamie Miller Senior Director of Economic, Workforce and Community Development finance.yahoo.com · 2026-10-22
What the article says
New leadership role aligns economic growth, workforce development and community investment to support Mississippi's future GULFPORT, Miss., Oct. 22, 2026 /PRNewswire/ -- Mississippi Power today announced that Jamie M. Miller has been named senior director of Economic, Workforce and Community development, a newly… source ↗
- XCF Global (Nasdaq:SAFX) Expands Strategy Focused on Cost-Competitive Renewable Fuels and U.S. Energy Production finance.yahoo.com · 2026-10-21
What the article says
Southern Energy Renewables expands XCF's technology and feedstock capabilities; combined company previously projected approximately $1.8 billion in revenue by 2030 HOUSTON, TX / ACCESS Newswire / October 21, 2026 / XCF Global Inc. ("XCF" or the "Company") (Nasdaq:SAFX) today highlighted the addition of Southern Energy… source ↗
- AEIC Elects 2027 Officers and Renews Board Terms finance.yahoo.com · 2026-10-21
What the article says
Ben Felton, Executive Vice President and Chief Operating Officer, Portland General Electric, named President for 2027 OJAI, Calif. , Oct. 21, 2026 /PRNewswire/ -- The Association of Edison Illuminating Companies (AEIC) elected its 2027 officers at its 142nd Annual Meeting in Ojai, California.AEIC Elects 2027 President… source ↗
- GE Vernova Highlights Spain's Path to Reliable, Net-Zero Electricity finance.yahoo.com · 2026-10-21
What the article says
GE Vernova GEV is highlighting how Spain can transition toward a net-zero electricity system by 2050 without compromising power reliability or affordability. The company outlined four potential pathways for Spain's electricity system, emphasizing the importance of balancing renewable energy expansion with grid… source ↗
What changed since last week
• New risk flag: earnings report coming up.
• No longer a strength: positive analyst ratings.
A description of facts from the filings and the market — not investment advice or a recommendation. "Cheap" and "expensive" are always relative to the comparison group. Educational information only — not investment advice. Not a registered investment adviser or broker-dealer.