 TechAnalyzer Pro
Synopsys Inc SNPS
Stock research in plain language · As of Oct 25, 2026 · updated once a week, after the trading week closes
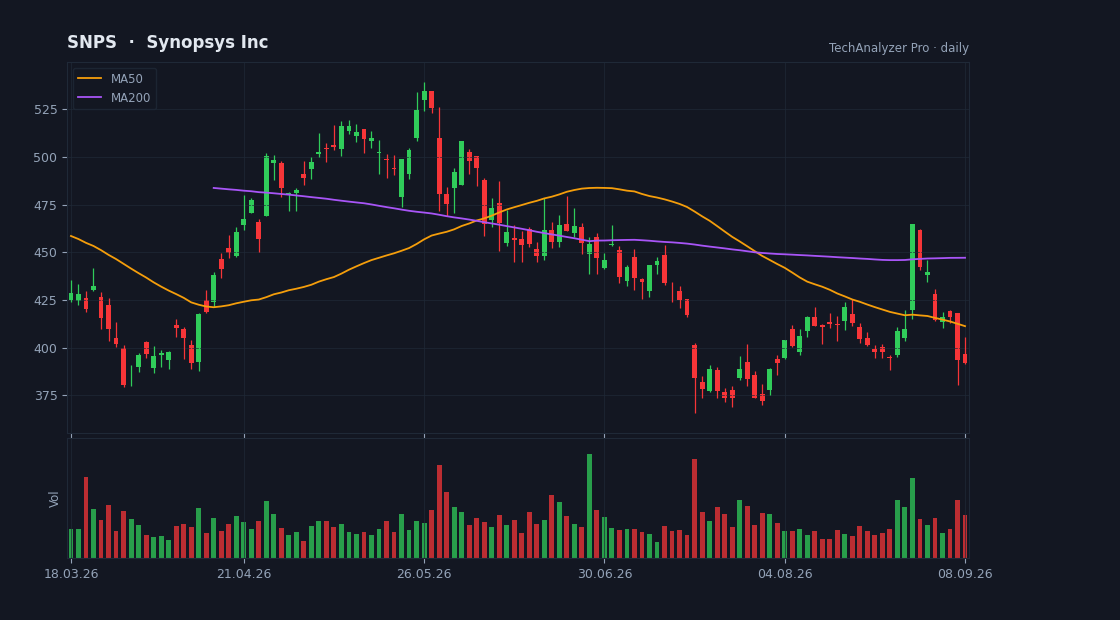
Daily candles, 50 and 200-day averages and volume · updated every trading day · click to open the live chart
What the company does
Synopsys Inc is a large-cap company in the Technology sector (Software - Infrastructure), with a market value of $82.4B, based in the USA.
It employs about 28,000 people and has been listed since Feb 26, 1992.
Synopsys, Inc. provides design IP solutions in the semiconductor and electronics industries. It operates in two segments, Design Automation and Design IP.
Cheap or expensive? relatively expensive
Its price-to-earnings (P/E) is 76.0 versus 38.7 for the median of the Technology sector in our universe (65 companies) — relatively expensive.
Revenue is growing 42% a year — the market is paying ahead for that growth. If it slows, the high multiple becomes the risk.
On analysts' next-year forecasts the multiple drops to 23.3 — they expect higher earnings.
The average analyst price target is 586.95, 36% above the current price (their view, not ours).
The stock sits at 38% of its one-year range (0% = the low, 100% = the high).
The risks
- ⚠️ The share count grew 19% in a year — each share owns a smaller slice of the company.
Strengths
- ✅ Profitable — 22 of every 100 dollars of revenue stays as profit.
- ✅ Generates free cash flow — profit becomes cash in the bank.
- ✅ Most analysts rate it buy (24 vs 0).
- ✅ Revenue is growing 42% a year.
What changed this week
Over the past week the stock fell 5.4% (for comparison: S&P 500 -0.4%, sector ETF XLK -0.1%).
This week's news
- Synopsys (SNPS) Rises As Market Takes a Dip: Key Facts finance.yahoo.com · 2026-10-23
What the article says
Synopsys (SNPS) closed at $430.14 in the latest trading session, marking a +1.81% move from the prior day. The stock outperformed the S&P 500, which registered a daily loss of 0.52%. Meanwhile, the Dow lost 1.24%, and the Nasdaq, a tech-heavy index, lost 0.21%. Shares of the maker of software used to test and develop… source ↗
- Wall Street Analysts See Synopsys (SNPS) as a Buy: Should You Invest? finance.yahoo.com · 2026-10-23
What the article says
The recommendations of Wall Street analysts are often relied on by investors when deciding whether to buy, sell, or hold a stock. Media reports about these brokerage-firm-employed (or sell-side) analysts changing their ratings often affect a stock's price. Do they really matter, though? Before we discuss the… source ↗
- What Morgan Stanley Sees In Synopsys Stock And Its AI Software Shift finance.yahoo.com · 2026-10-22
What the article says
Morgan Stanley recently argued that Synopsys' AI focused design tools and shift toward a consumption based licensing model are not fully reflected in current expectations for the business. The focus on usage based software economics highlights how Synopsys could align revenue more tightly with actual design activity… source ↗
- Synopsys (SNPS) Sees a More Significant Dip Than Broader Market: Some Facts to Know finance.yahoo.com · 2026-10-22
What the article says
Synopsys (SNPS) closed at $422.48 in the latest trading session, marking a -6.36% move from the prior day. The stock's performance was behind the S&P 500's daily loss of 1.21%. At the same time, the Dow added 0.02%, and the tech-heavy Nasdaq lost 2.6%. Shares of the maker of software used to test and develop chips… source ↗
- Synopsys Undervalued as Market Overlooks AI Revenue Opportunity, Morgan Stanley Says finance.yahoo.com · 2026-10-20
What the article says
Synopsys (SNPS) remains undervalued as the market overlooks its significant artificial intelligence- PREMIUM Upgrade to read this MT Newswires article and get so much more. A Silver or Gold subscription plan is required to access premium news articles. Upgrade Already have a subscription? Sign in source ↗
- Synopsys in focus as Morgan Stanley ups price target on AI hopes seekingalpha.com · 2026-10-20
What the article says
[Synopsys corporate headquarters in Silicon Valley] Sundry Photography * Synopsys (SNPS [https://seekingalpha.com/symbol/SNPS]) was in focus on Tuesday as Morgan Stanley upped its price target on the electronic design automation firm, citing the coming benefit from artificial intelligence. * Shares fell 0.8% in… source ↗
What changed since last week
• Risk flag cleared: high volatility.
• The price fell 5.4% since the last summary.
A description of facts from the filings and the market — not investment advice or a recommendation. "Cheap" and "expensive" are always relative to the comparison group. Educational information only — not investment advice. Not a registered investment adviser or broker-dealer.