 TechAnalyzer Pro
Charles Schwab Corp SCHW
Stock research in plain language · As of Oct 25, 2026 · updated once a week, after the trading week closes
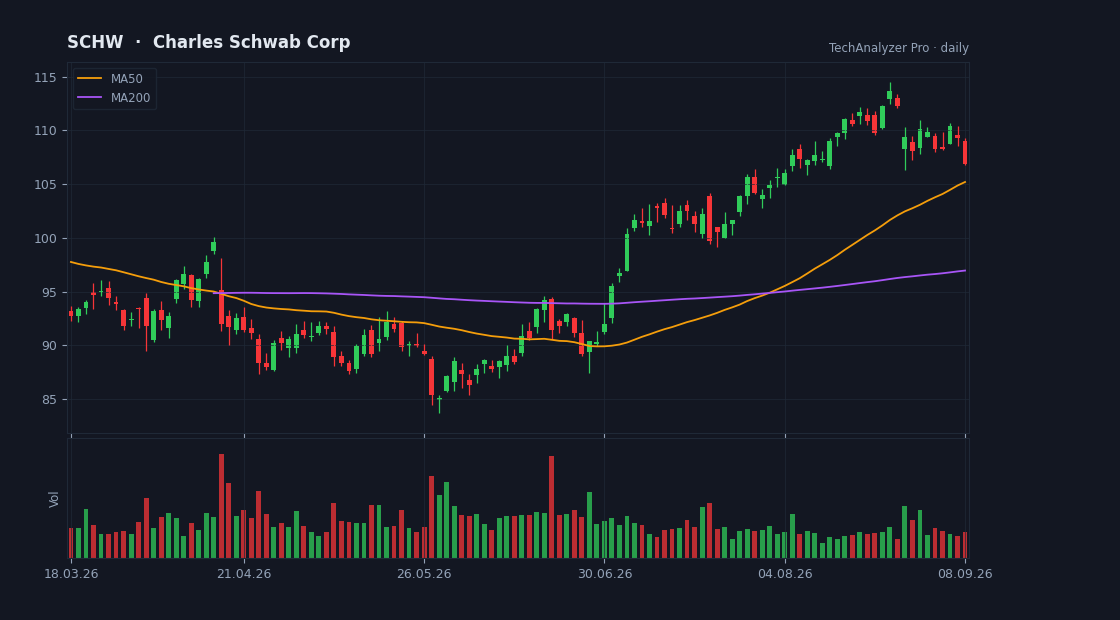
Daily candles, 50 and 200-day averages and volume · updated every trading day · click to open the live chart
What the company does
Charles Schwab Corp is a large-cap company in the Financial Services sector (Capital Markets), with a market value of $156.6B, based in the USA.
It employs about 33,900 people and has been listed since Sep 22, 1987.
The Charles Schwab Corporation, together with its subsidiaries, operates as a savings and loan holding company that provides wealth management, securities brokerage, banking, asset management, custody, and financial advisory services in the United States and internationally. The company operates in two segments, Investor Services and Advisor Services. It offers brokerage accounts with equity and fixed income trading, margin lending, options trading, futures and forex trading, and cash management capabilities, including money market funds, and certificates of deposit; third-party mutual funds through the Mutual Fund Marketplace and Mutual Fund OneSource service, as well as mutual fund trading and clearing services to broker-dealers; exchange-traded funds; advisory solutions for managed portfolios, separately managed accounts, customized personal advice for tailored portfolios, specialized planning, and full-time portfolio management; banking products comprising checking and savings accounts, first lien residential real estate mortgage loans, home equity lines of credit, and pledged asset lines; and trust custody services, personal trust reporting services, and administrative trustee
Cheap or expensive? priced in line with its group
Its price-to-earnings (P/E) is 15.5 versus 14.1 for the median of the Financial Services sector in our universe (19 companies) — priced in line with its group.
Revenue is growing 17% versus the same quarter last year.
On analysts' next-year forecasts the multiple rises to 17.3 — they expect lower earnings.
The average analyst price target is 117.59, 30% above the current price (their view, not ours).
The stock sits at 22% of its one-year range (0% = the low, 100% = the high).
The risks
- No risk flags were detected from the data we have.
Strengths
- ✅ Profitable — 36 of every 100 dollars of revenue stays as profit.
- ✅ Buys back its shares (4% fewer shares in a year).
- ✅ More cash than debt.
- ✅ Most analysts rate it buy (18 vs 1).
- ✅ Revenue is growing 17% a year.
- ✅ Pays a dividend (1.4% a year).
What changed this week
Over the past week the stock fell 1.5% (for comparison: S&P 500 -0.4%, sector ETF XLF +0.7%).
This week's news
- Why Charles Schwab Stock Could Benefit If Short Term Rates Stay Higher finance.yahoo.com · 2026-10-23
What the article says
Inflation is refusing to fade, short-term rates are higher, and the AI boom now has a real funding cost attached to it. That mix is punishing for some sectors, yet it can quietly reshape how cash-rich financial firms earn on client balances. If you care where your capital sits when policy stays tight, keep reading.… source ↗
- Schwab Declares Quarterly Common Stock Dividend and Declares Preferred Stock Dividends finance.yahoo.com · 2026-10-22
What the article says
WESTLAKE, Texas, October 22, 2026--(BUSINESS WIRE)--The Board of Directors of The Charles Schwab Corporation at its meeting today declared a regular quarterly cash dividend of $0.32 per common share. The dividend is payable November 27, 2026 to stockholders of record as of the close of business on November 13, 2026.… source ↗
- Zoe Financial CEO Andres Garcia-Amaya to Speak on Growth at Charles Schwab IMPACT(R) 2026 finance.yahoo.com · 2026-10-22
What the article says
Next week, Zoe's founder will join a panel of RIA leaders to talk about how firms can grow and still give great service to clients NEW YORK CITY, NY / ACCESS Newswire / October 22, 2026 / Zoe Financial, a wealth management platform helping registered investment advisers (RIAs) grow more efficiently and deliver… source ↗
- ETF Central: An Introduction to the Schwab International Bond ETF finance.yahoo.com · 2026-10-20
What the article says
Riz Hussain, investment strategist and portfolio consultant, and John Greves, managing director and head of multi-asset strategy at Schwab Asset Management, join Bilal Little on ETF Central to discuss Schwab's new international bond index, built in partnership with ICE. They walk through how the index is constructed,… source ↗
- The Banks Locked Agents Out. This Week an Agent Paid an Invoice Through the Front Door. finance.yahoo.com · 2026-10-20
What the article says
Between October 13 and October 16, JPMorgan Chase, Bank of America, Citi, Schwab, and Wells Fargo locked AI agents out of consumer accounts. The response included four hard blocks and one contract rewrite. Jamie Dimon, CEO of JPMorgan Chase, characterized the move as a "liability transfer," citing concerns over… source ↗
- 8 ‘Safe’ Stocks That Are Much Riskier Than They Look finance.yahoo.com · 2026-10-20
What the article says
Some low beta stocks are more volatile on big down days for the market, including RTX, Charles Schwab, Union Pacific, Danaher, and Starbucks. Continue Reading source ↗
What changed since last week
No material change: same valuation verdict, same risk flags, price moved less than 3%.
A description of facts from the filings and the market — not investment advice or a recommendation. "Cheap" and "expensive" are always relative to the comparison group. Educational information only — not investment advice. Not a registered investment adviser or broker-dealer.