 TechAnalyzer Pro
Pfizer Inc PFE
Stock research in plain language · As of Oct 25, 2026 · updated once a week, after the trading week closes
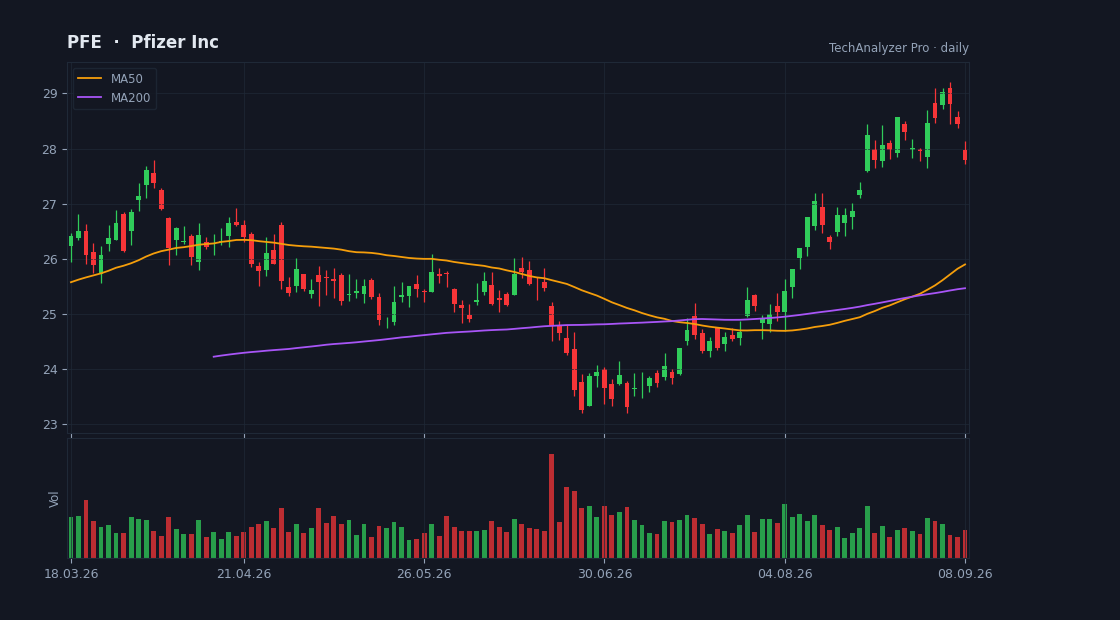
Daily candles, 50 and 200-day averages and volume · updated every trading day · click to open the live chart
What the company does
Pfizer Inc is a large-cap company in the Healthcare sector (Drug Manufacturers - General), with a market value of $171.2B, based in the USA.
It employs about 75,000 people and has been listed since Jun 22, 1942.
Pfizer Inc. discovers, develops, manufactures, markets, distributes, and sells biopharmaceutical products in the United States and internationally. It operates in three segments: Biopharma, PC1, and Pfizer Ignite.
Cheap or expensive? relatively cheap
The company is loss-making, so it has no P/E — we compare on price-to-sales instead.
Its price-to-sales (P/S) is 2.7 versus 5.9 for 4 direct peers — relatively cheap.
Revenue is growing 3% versus the same quarter last year.
The average analyst price target is 29.26, 3% below the current price (their view, not ours).
The stock sits at 95% of its one-year range (0% = the low, 100% = the high).
The risks
- • The company is loss-making.
- • Quarterly report in 9 days (2026-11-03) — a day the stock can move a lot.
Strengths
- ✅ Generates free cash flow — profit becomes cash in the bank.
- ✅ Most analysts rate it buy (9 vs 2).
- ✅ Pays a dividend (5.7% a year).
What changed this week
Over the past week the stock rose 1.5% (for comparison: S&P 500 -0.4%, sector ETF XLV +1.4%).
It set a new one-year high this week.
This week's news
- Pfizer And 2 Other AI Healthcare Stocks To Watch finance.yahoo.com · 2026-10-24
What the article says
Warning signs around heavily indebted AI infrastructure firms have grown louder after analysts raised the risk of a tech debt spiral, with some newer players struggling to finance data centers and high-end chips. That strain shifts attention toward more grounded uses of AI that address urgent problems such as… source ↗
- Pfizer sees strong response for pediatric pneumonia vaccine in mid-stage trial seekingalpha.com · 2026-10-24
What the article says
[Flu Shot] FatCamera/iStock via Getty Images * Data from a phase 2 trial of Pfizer's (PFE [https://seekingalpha.com/symbol/PFE]) pediatric 25-valent pneumococcal conjugate vaccine PF-07872412 (25vPnC) showed that a four-dose series of the candidate provoked a robust immune response against all 25 serotypes. * The shot… source ↗
- Pfizer's 25-Valent Pediatric Pneumococcal Conjugate Vaccine Candidate Shows Robust Phase 2 Data at IDWeek 2026 finance.yahoo.com · 2026-10-24
What the article says
Investigational vaccine shows strong immune responses in infants equivalent to PREVNAR 20® on shared serotypes and for five new serotypes, potentially offering the broadest protection against invasive pneumococcal disease (IPD) for pediatric population in the U.S. NEW YORK, October 24, 2026--(BUSINESS WIRE)--Pfizer… source ↗
- Is Pfizer (PFE) Cheap As Its Enodia Deal Fuels Oncology Growth Hopes? finance.yahoo.com · 2026-10-24
What the article says
Pfizer (PFE) is back in focus after signing a research collaboration and license agreement with Enodia Therapeutics that gives the drugmaker access to Enodia's Sec61 inhibitor programs for potential oncology and specialty treatments. Pfizer's agreement with Enodia lands at a time when momentum in the shares has been… source ↗
- U.S. Treasury Wants to Rein In Deals for Chinese Biotech and AI finance.yahoo.com · 2026-10-23
What the article says
The prohibitions could cut off Big Pharma from Chinese biotechs—the source of many promising cancer treatments Continue Reading source ↗
- Moderna stock crashes as leaked melanoma data threatens its record August rally finance.yahoo.com · 2026-10-22
What the article says
Two months ago, Moderna's (MRNA) melanoma vaccine handed the stock its best day ever. Now leaked results from the same trial have it challenging its worst. It's on track for its biggest drop on record. A close below $187.92 would top its 23.55% drop on Aug. 20, which came the session right after its best day. (MRNA )… source ↗
What changed since last week
• New risk flag: earnings report coming up.
A description of facts from the filings and the market — not investment advice or a recommendation. "Cheap" and "expensive" are always relative to the comparison group. Educational information only — not investment advice. Not a registered investment adviser or broker-dealer.