 TechAnalyzer Pro
PepsiCo Inc PEP
Stock research in plain language · As of Oct 25, 2026 · updated once a week, after the trading week closes
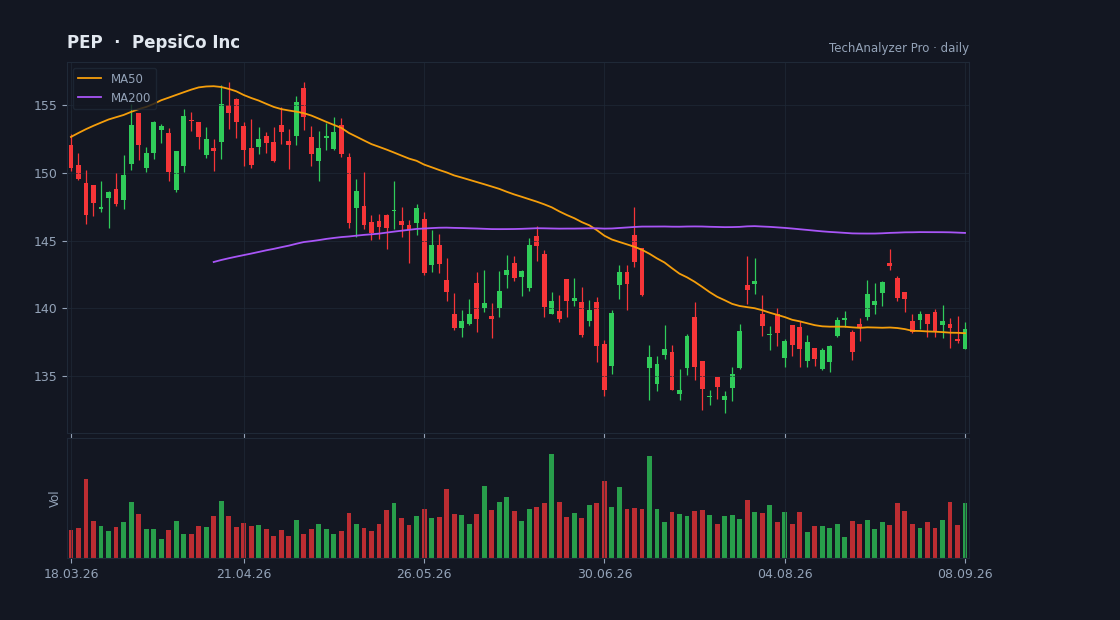
Daily candles, 50 and 200-day averages and volume · updated every trading day · click to open the live chart
What the company does
PepsiCo Inc is a large-cap company in the Consumer Defensive sector (Beverages - Non-Alcoholic), with a market value of $185.0B, based in the USA.
It employs about 306,000 people and has been listed since Jan 13, 1978.
PepsiCo, Inc. engages in the manufacture, marketing, distribution, and sale of various beverages and convenient foods worldwide. The company operates through six segments: PepsiCo Foods North America; PepsiCo Beverages North America; International Beverages Franchise; Europe, Middle East and Africa; Latin America Foods; and Asia Pacific Foods.
Cheap or expensive? relatively cheap
Its price-to-earnings (P/E) is 17.1 versus 35.0 for 3 direct peers — relatively cheap.
Revenue is growing 6% versus the same quarter last year.
On analysts' next-year forecasts the multiple drops to 14.9 — they expect higher earnings.
The average analyst price target is 141.59, 4% above the current price (their view, not ours).
The stock sits at 29% of its one-year range (0% = the low, 100% = the high).
The risks
- • Net debt is 1.8× shareholders' equity — high leverage.
Strengths
- ✅ Profitable — 12 of every 100 dollars of revenue stays as profit.
- ✅ Generates free cash flow — profit becomes cash in the bank.
- ✅ Most analysts rate it buy (6 vs 1).
- ✅ Pays a dividend (4.2% a year).
What changed this week
Over the past week the stock rose 3.3% (for comparison: S&P 500 -0.4%, sector ETF XLP +0.7%).
This week's news
- Insider trades: Blackberry, Accenture and Cleveland-Cliffs among notable names seekingalpha.com · 2026-10-24
What the article says
This week insider transactions were seen across firms like Blackberry, Accenture, Cleveland-Cliffs. The following is the list of deals that took place during the week. BlackBerry (BB [https://seekingalpha.com/symbol/BB]) CEO John Giamatteo sold a combined 250,000 shares of the company’s stock in two transactions on… source ↗
- Pepsi Tastes a Victory finance.yahoo.com · 2026-10-23
What the article says
PepsiCo has had a rough stretch in the cola wars. Continue Reading source ↗
- PepsiCo (PEP) Renews Taco Bell Deal, Is The Stock A Bargain? finance.yahoo.com · 2026-10-23
What the article says
PepsiCo (PEP) is back in focus after renewing its beverage partnership with Taco Bell for 11 years. The move keeps exclusive fountain rights in key Yum Brands restaurants through 2036. Investors saw that renewal hit the tape alongside a 1-day share price return of 3.07% and a 7-day share price gain of 8.14%. However,… source ↗
- Unusual Options Volume Report: PepsiCo Stock finance.yahoo.com · 2026-10-23
What the article says
PepsiCo Inc (NASDAQ) stock is down 2.3% at $135.59 this morning, on track to snap a five-day winning streak. The beverage giant has been climbing off its Oct. 7 six-year low of $123.47. However, the shares are pulling back after running into resistance at the 120-day moving average, and remain down 5.4% in 2026.PEP… source ↗
- Consumer staples on track for best month since 1998 as sector surges seekingalpha.com · 2026-10-23
What the article says
[Trolley filled with groceries in wholesale store Landscape] Smile/DigitalVision via Getty Images The S&P 500 consumer staples sector is on track for its strongest monthly performance since October 1998, with the sector’s latest advance standing out against a history of sharp swings between gains and losses, according… source ↗
- From Starbucks to the CDC: Alliance to Stop Foodborne Illness Names 40 Food Safety Professionals Under 40, Class Of 2026 finance.yahoo.com · 2026-10-23
What the article says
Honorees from PepsiCo, Nestlé, Oscar Mayer, Cargill and more are using AI, new technology and smart traceability to keep food safe, across four continents. CHICAGO, Oct. 23, 2026 /PRNewswire/ -- Today, the Alliance to Stop Foodborne Illness, a program of the nonprofit consumer advocacy group Stop Foodborne Illness,… source ↗
What changed since last week
• The price rose 3.3% since the last summary.
A description of facts from the filings and the market — not investment advice or a recommendation. "Cheap" and "expensive" are always relative to the comparison group. Educational information only — not investment advice. Not a registered investment adviser or broker-dealer.