 TechAnalyzer Pro
Payoneer Global Inc PAYO
Stock research in plain language · As of Oct 23, 2026 · updated once a week, after the trading week closes
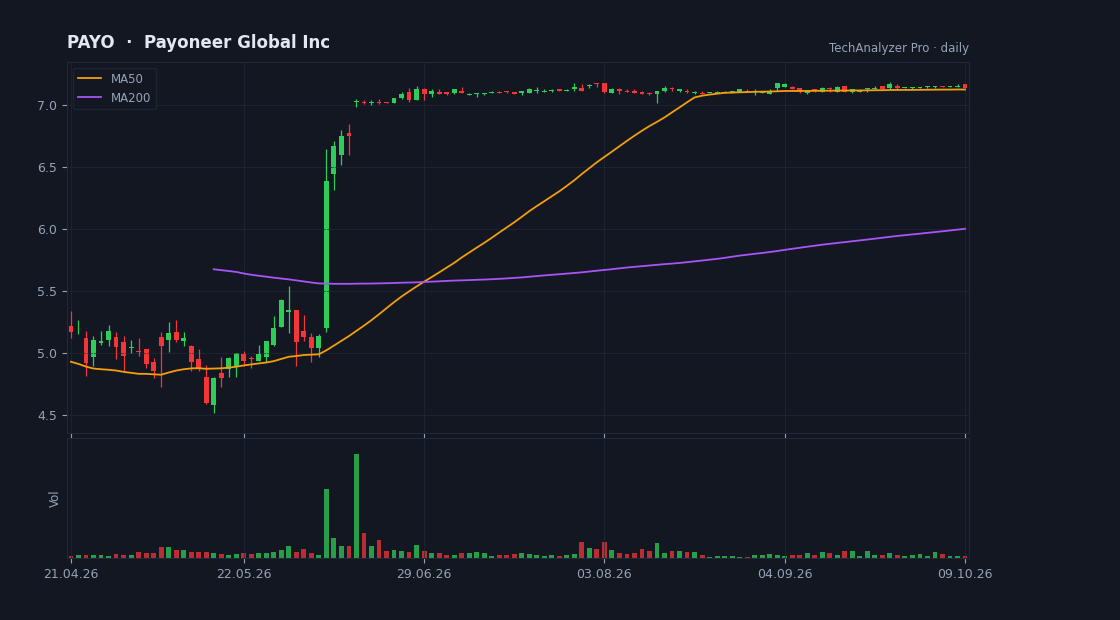
Daily candles, 50 and 200-day averages and volume · updated every trading day · click to open the live chart
What the company does
Payoneer Global Inc is a mid-cap company in the Technology sector (Software - Infrastructure), with a market value of $2.4B, based in the USA.
It employs about 2,540 people and has been listed since Jun 28, 2021.
Payoneer Global Inc. operates as a financial technology company. The company offers customers with a multi-currency account to serve their cross-border accounts receivable and accounts payable needs through payment infrastructure platform.
Cheap or expensive? relatively cheap
The company is loss-making, so it has no P/E — we compare on price-to-sales instead.
Its price-to-sales (P/S) is 2.2 versus 6.6 for the median of the Technology sector in our universe (65 companies) — relatively cheap.
Revenue is growing 5% versus the same quarter last year.
The average analyst price target is 7.40, 3% above the current price (their view, not ours).
The stock sits at 99% of its one-year range (0% = the low, 100% = the high).
The risks
- • The company is loss-making.
- • Quarterly report in 12 days (2026-11-04) — a day the stock can move a lot.
Strengths
- ✅ Generates free cash flow — profit becomes cash in the bank.
- ✅ Buys back its shares (11% fewer shares in a year).
- ✅ More cash than debt.
What changed this week
Over the past week the stock rose 0.4% (for comparison: S&P 500 -1.0%, sector ETF XLK -3.6%).
This week's news
- Simplifying Cross-Border Payments: Nium CFO Andre Mancl, Live from Money 20/20 2026 finance.yahoo.com · 2026-10-22
What the article says
Tech Edge hosted a fireside chat on at Money20/20 USA 2026 in Las Vegas, Nevada, with Andre Mancl, Chief Financial Officer at Nium. The in-person interview was joined by Editor-in-Chief John Jannarone and they discussed the company's global expansion, particularly in the Americas, and its mission to simplify… source ↗
- Payoneer to Report Third Quarter 2026 Results on November 5, 2026 finance.yahoo.com · 2026-10-22
What the article says
NEW YORK, Oct. 22, 2026 /PRNewswire/ -- Payoneer Global Inc. (NASDAQ: PAYO) ("Payoneer" or the "Company"), the global financial technology company powering business growth across borders, will report its Third Quarter 2026 financial results on Thursday, November 5, 2026, before the market opens.Payoneer logo In light… source ↗
What changed since last week
• New risk flag: earnings report coming up.
A description of facts from the filings and the market — not investment advice or a recommendation. "Cheap" and "expensive" are always relative to the comparison group. Educational information only — not investment advice. Not a registered investment adviser or broker-dealer.