 TechAnalyzer Pro
Netflix Inc NFLX
Stock research in plain language · As of Oct 25, 2026 · updated once a week, after the trading week closes
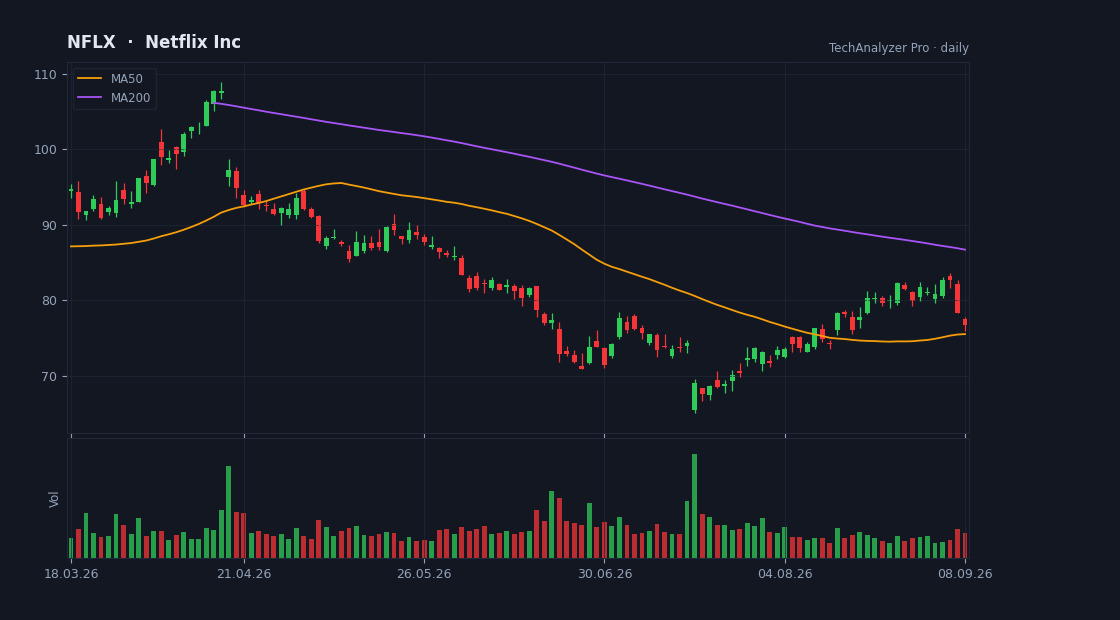
Daily candles, 50 and 200-day averages and volume · updated every trading day · click to open the live chart
What the company does
Netflix Inc is a mega-cap company in the Communication Services sector (Entertainment), with a market value of $274.2B, based in the USA.
It employs about 16,000 people and has been listed since May 23, 2002.
Netflix, Inc. provides entertainment services worldwide. The company offers television (TV) series, documentaries, feature films, games, and live programming across various genres and languages.
Cheap or expensive? relatively cheap
Its price-to-earnings (P/E) is 19.0 versus 45.3 for 4 direct peers — relatively cheap.
Revenue is growing 12% versus the same quarter last year.
On analysts' next-year forecasts the multiple rises to 20.2 — they expect lower earnings.
The average analyst price target is 84.83, 29% above the current price (their view, not ours).
The stock sits at 3% of its one-year range (0% = the low, 100% = the high).
The risks
- • The stock is more volatile than average (beta 1.6) — big daily moves both ways.
- • The stock is 44% below its one-year high.
Strengths
- ✅ Profitable — 28 of every 100 dollars of revenue stays as profit.
- ✅ Generates free cash flow — profit becomes cash in the bank.
- ✅ Buys back its shares (4% fewer shares in a year).
- ✅ Most analysts rate it buy (33 vs 2).
What changed this week
Over the past week the stock fell 6.6% (for comparison: S&P 500 -0.4%, sector ETF XLC -4.4%).
It set a new one-year low this week.
The company published its quarterly report this week — see the plain-language summary above.
This week's news
- What Does Netflix (NFLX) Leadership Shake Up Mean For Its Content Direction? finance.yahoo.com · 2026-10-24
What the article says
Netflix (NasdaqGS:NFLX) removed film chief Dan Lin abruptly, following a recent change in its chief content officer role. Around 1,000 employees are being laid off in what is described as the largest workforce reduction in Netflix history. The shake up includes several senior content leaders exiting, signaling a broad… source ↗
- Earnings Scoreboard: 82% firms beat EPS estimates, 79% post Y/Y earnings growth seekingalpha.com · 2026-10-24
What the article says
[Top view image of text THIRD QUARTER on office desk.] mohd izzuan Earnings season gathered momentum during the last week, with 76 S&P 500 companies reporting results across key sectors, including Financials, Communication Services, Consumer Discretionary, Industrials, and Energy. The results offered a fresh look at… source ↗
- 5 out of 5 communications services stocks deliver EPS wins this week: Earnings Scorecard seekingalpha.com · 2026-10-24
What the article says
Communications services stocks grabbed the spotlight this week as Wall Street digested earnings reports from major names, including Netflix (NFLX [https://seekingalpha.com/symbol/NFLX]) and Meta Platforms (META [https://seekingalpha.com/symbol/META]). The communications services sector (XLC… source ↗
- US Equity Indexes Close Mixed This Week as Investors Rotate into Treasury Bonds, Defensives as AI Trade Falters finance.yahoo.com · 2026-10-23
What the article says
US equity indexes closed mix this week as the so-called AI trade faltered following corporate result PREMIUM Upgrade to read this MT Newswires article and get so much more. A Silver or Gold subscription plan is required to access premium news articles. Upgrade Already have a subscription? Sign in source ↗
- ‘I Watch Something on YouTube Every Day’ but Netflix a ‘Dormant Subscription,’ Says Chamath Palihapitiya Underlining a Financial Lesson finance.yahoo.com · 2026-10-23
What the article says
Benzinga and Yahoo Finance LLC may earn commission or revenue on some items through the links below. On Tuesday, Social Capital founder Chamath Palihapitiya questioned Netflix Inc.'s (NASDAQ) content strategy and debt burden after the streaming giant reported third-quarter results that narrowly missed revenue… source ↗
- SA Asks: Netflix hit a 52-week low this week. Is now the time to buy? seekingalpha.com · 2026-10-23
What the article says
[A Person holds an Apple TV remote using the new Netflix app with a hand. Netflix dominates Golden Globe Nominations. Illustrative] Marvin Samuel Tolentino Pineda/iStock Editorial via Getty Images Netflix's (NFLX [https://seekingalpha.com/symbol/NFLX]) stock price hit a new 52-week low earlier this week amid concerns… source ↗
What changed since last week
• Risk flag cleared: earnings report coming up.
• The price fell 6.7% since the last summary.
• The average analyst target moved from 92.06 to 84.83.
• A new quarterly report was published (quarter ended Sep 30, 2026).
A description of facts from the filings and the market — not investment advice or a recommendation. "Cheap" and "expensive" are always relative to the comparison group. Educational information only — not investment advice. Not a registered investment adviser or broker-dealer.