 TechAnalyzer Pro
Morgan Stanley MS
Stock research in plain language · As of Oct 25, 2026 · updated once a week, after the trading week closes
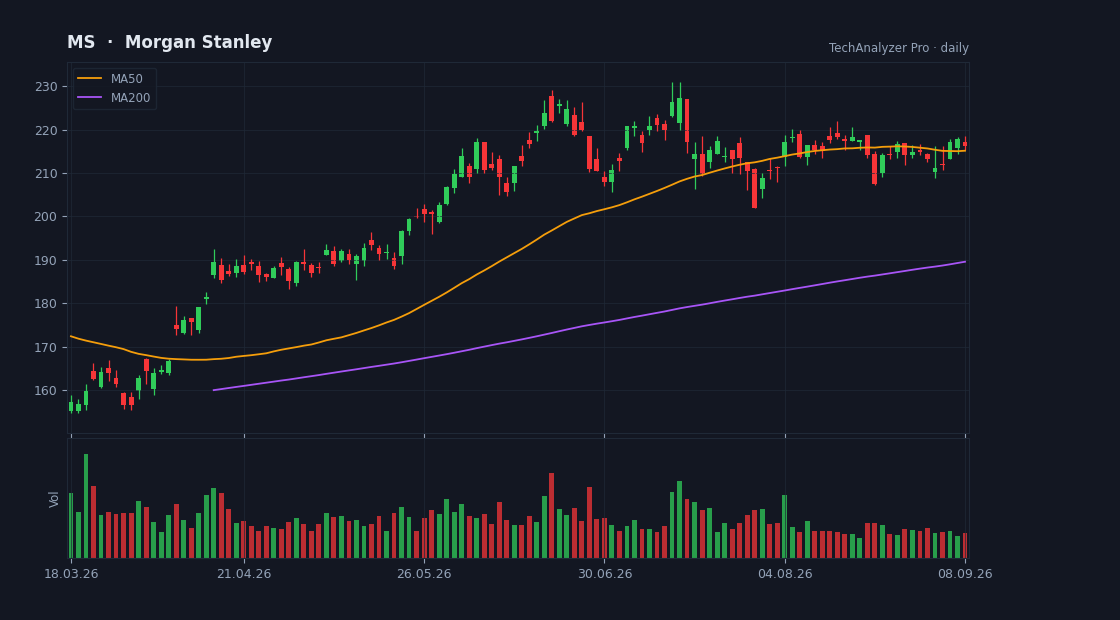
Daily candles, 50 and 200-day averages and volume · updated every trading day · click to open the live chart
What the company does
Morgan Stanley is a mega-cap company in the Financial Services sector (Capital Markets), with a market value of $281.9B, based in the USA.
It employs about 83,728 people and has been listed since Feb 23, 1993.
Morgan Stanley, a financial holding company, provides various financial products and services to corporations, governments, financial institutions, and individuals in the Americas, Asia, Europe, the Middle East, and Africa. It operates through Institutional Securities, Wealth Management, and Investment Management segments. The company offers capital raising and financial advisory services, including services related to the underwriting of debt, equity securities, and other products, as well as advice on mergers and acquisitions, restructurings, and project finance.
Cheap or expensive? priced in line with its group
Its price-to-earnings (P/E) is 14.2 versus 12.3 for 4 direct peers — priced in line with its group.
Revenue is growing 11% versus the same quarter last year.
On analysts' next-year forecasts the multiple rises to 14.9 — they expect lower earnings.
The average analyst price target is 211.05, 18% above the current price (their view, not ours).
The stock sits at 36% of its one-year range (0% = the low, 100% = the high).
The risks
- No risk flags were detected from the data we have.
Strengths
- ✅ Profitable — 15 of every 100 dollars of revenue stays as profit.
- ✅ Buys back its shares (1% fewer shares in a year).
- ✅ Most analysts rate it buy (11 vs 1).
- ✅ Pays a dividend (2.3% a year).
What changed this week
Over the past week the stock fell 0.6% (for comparison: S&P 500 -0.4%, sector ETF XLF +0.7%).
This week's news
- Goldman's Equities Revenues Jump 72% Y/Y in Q3: Can Growth Sustain? finance.yahoo.com · 2026-10-23
What the article says
The Goldman Sachs Group, Inc. GS delivered robust performance in its Equities business in the third quarter of 2026, benefiting from strong client activity, rising financing demand and strength in derivatives. Third-quarter Equities net revenues surged 72% year over year to $6.44 billion, marking the company's… source ↗
- What Morgan Stanley Sees In Synopsys Stock And Its AI Software Shift finance.yahoo.com · 2026-10-22
What the article says
Morgan Stanley recently argued that Synopsys' AI focused design tools and shift toward a consumption based licensing model are not fully reflected in current expectations for the business. The focus on usage based software economics highlights how Synopsys could align revenue more tightly with actual design activity… source ↗
- Morgan Stanley Sustainable Signals: Global Survey Shows Institutional Investors Expect Modest Growth in Sustainable Investment Allocations finance.yahoo.com · 2026-10-22
What the article says
More than 80% of asset owners and asset managers expect sustainable allocations to increase over the next two years, but at a lower pace than 2025 Top drivers include growth opportunities and rising materiality of sustainability risks, with data availability the leading concern Two-thirds of institutional investors… source ↗
- Meta Stock Falls. Earnings Show Just How Much Future Growth Will Cost. finance.yahoo.com · 2026-10-22
What the article says
Mounting expenses are weighing on Meta Platform’s profitability and the company admits scaling Muse is going to costly. Continue Reading source ↗
- Is It Time for a New CEO at Bank of America? finance.yahoo.com · 2026-10-22
What the article says
Brian Moynihan is back in the hot seat, following disappointing earnings and a large U.S. Treasury fine. Why it might be time for the longtime CEO to move on. Continue Reading source ↗
- Amkor Technology (AMKR) Stock Gets Fair Value Trim As Analysts Split On AI Demand finance.yahoo.com · 2026-10-22
What the article says
The model fair value estimate for Amkor Technology has been adjusted from US$76.4 to US$74.5, signalling a slightly more conservative price target in the latest update. This shift mirrors the split analyst narrative, with optimism around AI related packaging and server CPUs balanced against concerns over… source ↗
What changed since last week
• No longer a strength: revenue growth.
• The average analyst target moved from 222.14 to 211.05.
A description of facts from the filings and the market — not investment advice or a recommendation. "Cheap" and "expensive" are always relative to the comparison group. Educational information only — not investment advice. Not a registered investment adviser or broker-dealer.