 TechAnalyzer Pro
Lululemon Athletica Inc. LULU
Stock research in plain language · As of Oct 25, 2026 · updated once a week, after the trading week closes
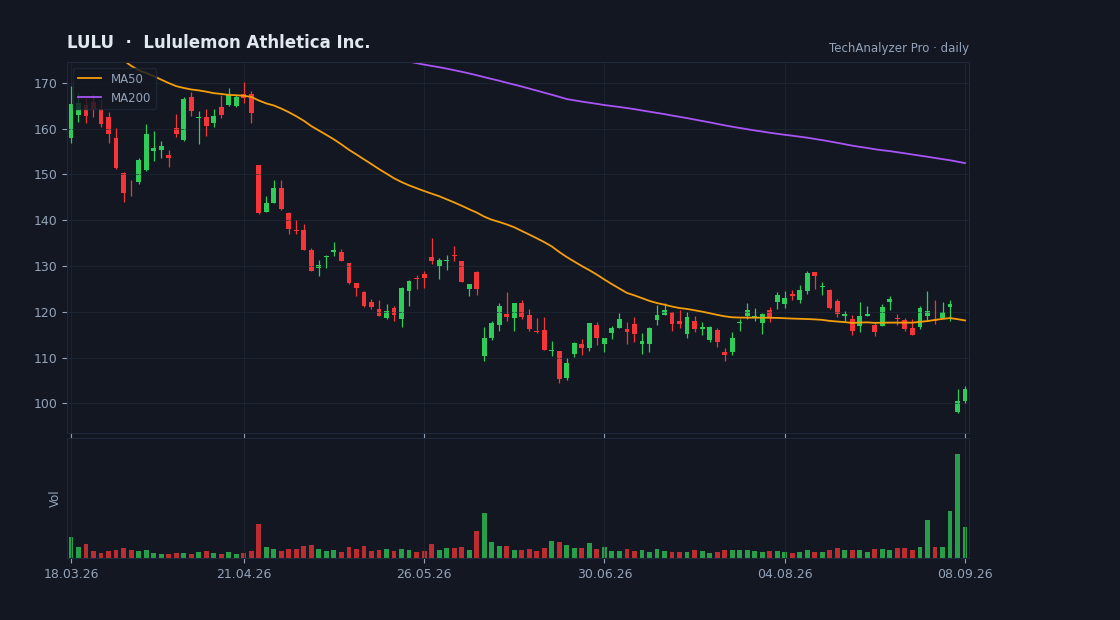
Daily candles, 50 and 200-day averages and volume · updated every trading day · click to open the live chart
What the company does
Lululemon Athletica Inc. is a large-cap company in the Consumer Cyclical sector (Apparel Retail), with a market value of $11.5B, based in the USA.
It employs about 39,000 people and has been listed since Jul 27, 2007.
lululemon athletica inc., together with its subsidiaries, designs, distributes, and retails technical athletic apparel, footwear, and accessories for women and men under the lululemon brand in the United States, Canada, Mexico, China, Hong Kong, Taiwan, Macau, Greece, and internationally. It offers pants, shorts, tops, and jackets for athletic activities, such as yoga, running, training, and other activities. The company also provides fitness-inspired accessories.
Cheap or expensive? relatively cheap
Its price-to-earnings (P/E) is 8.1 versus 17.9 for 4 direct peers — relatively cheap.
Revenue is shrinking 4% versus the same quarter last year.
On analysts' next-year forecasts the multiple rises to 10.7 — they expect lower earnings.
The average analyst price target is 103.66, 5% above the current price (their view, not ours).
The stock sits at 6% of its one-year range (0% = the low, 100% = the high).
The risks
- • 15% of the float is sold short — part of the market is betting on a decline.
- • The stock is 56% below its one-year high.
- • More analysts rate it sell (6) than buy (1).
Strengths
- ✅ Profitable — 14 of every 100 dollars of revenue stays as profit.
- ✅ Generates free cash flow — profit becomes cash in the bank.
- ✅ Buys back its shares (6% fewer shares in a year).
What changed this week
Over the past week the stock rose 2.0% (for comparison: S&P 500 -0.4%, sector ETF XLY +0.6%).
This week's news
- Lululemon (LULU) Suffers a Larger Drop Than the General Market: Key Insights finance.yahoo.com · 2026-10-23
What the article says
In the latest close session, Lululemon (LULU) was down 4.85% at $99.01. The stock fell short of the S&P 500, which registered a loss of 0.52% for the day. At the same time, the Dow lost 1.24%, and the tech-heavy Nasdaq lost 0.21%. Prior to today's trading, shares of the athletic apparel maker had gained 2.38% lagged… source ↗
- lululemon Announces Appointment of Tara Poseley to Board of Directors finance.yahoo.com · 2026-10-22
What the article says
Independent director brings more than 30 years of experience in product innovation and building global consumer and retail brands VANCOUVER, British Columbia, October 22, 2026--(BUSINESS WIRE)--lululemon athletica inc. (NASDAQ:LULU) today announced the appointment of Tara Poseley to its Board of Directors, effective… source ↗
- How Ross and On Holding Can Buck That Retail Funk finance.yahoo.com · 2026-10-22
What the article says
Ross Stores and On Holding are two plays for Wolfe Research’s Spencer Hanus, who just initiated coverage of the specialty retail sector. Continue Reading source ↗
- NIKE's Digital Sales Slowdown: Short-Term Hurdle or Trend? finance.yahoo.com · 2026-10-22
What the article says
NIKE, Inc. NKE is facing challenges in its direct-to-consumer (DTC) business as digital sales remain under pressure. The company's digital platform, including its websites and apps, has been an important channel for engaging consumers, promoting new products and improving profitability. However, persistent weakness in… source ↗
- Lululemon (LULU) Stock Looks Overvalued Following Its 78% Five Year Slump finance.yahoo.com · 2026-10-22
What the article says
lululemon athletica has seen its share price fall hard in recent years, which puts a spotlight on a simple question for investors who still follow the story. Do the cash flows of the business support where the stock trades today, or has sentiment moved further than the fundamentals? The share price has fallen 77.7%… source ↗
- Retail Comebacks Are Rare. History Says These Stocks Could Be AI Winners. finance.yahoo.com · 2026-10-21
What the article says
Comebacks in retail are few and far between, Bernstein writes in a new analysis of the sector’s pivots over the past century. Continue Reading source ↗
What changed since last week
No material change: same valuation verdict, same risk flags, price moved less than 3%.
A description of facts from the filings and the market — not investment advice or a recommendation. "Cheap" and "expensive" are always relative to the comparison group. Educational information only — not investment advice. Not a registered investment adviser or broker-dealer.