 TechAnalyzer Pro
Johnson & Johnson JNJ
Stock research in plain language · As of Oct 25, 2026 · updated once a week, after the trading week closes
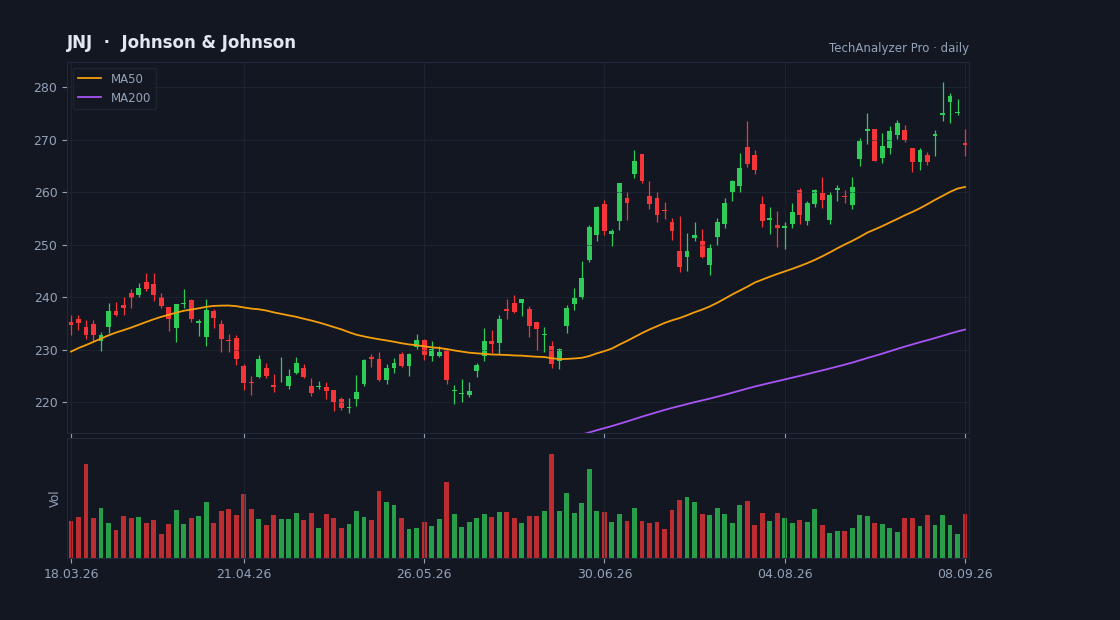
Daily candles, 50 and 200-day averages and volume · updated every trading day · click to open the live chart
The bottom line
Johnson & Johnson is a huge drug and medical-device maker worth about $635bn, and its stock moves mainly on trial data, regulatory decisions and structural business moves. This week it rose 3.2% while the S&P 500 fell 0.43%, against the prostate-cancer trial readout. Last quarter revenue was $25.4bn, up 5.9% year over year, while net income was just $210m versus $6.4bn of free cash flow — a gap that points to large one-off charges. A PE of 40 sits close to the peer median of 41.7, so pricing assumes continued growth and a productive pipeline; the central tension is between clinical innovation and reliance on existing drugs plus deals that may not close.
An explanation of the mechanics from the facts on this page, not advice.
What the company does
Johnson & Johnson is a mega-cap company in the Healthcare sector (Drug Manufacturers - General), with a market value of $635.1B, based in the USA.
It employs about 138,200 people and has been listed since Sep 24, 1944.
Johnson & Johnson, together with its subsidiaries, engages in the research and development, manufacture, and sale of a range of products in the healthcare field worldwide. It operates in two segments, Innovative Medicine and MedTech. The Innovative Medicine segment offers products for various therapeutic areas, such as oncology, immunology, neuroscience, pulmonary hypertension, infectious diseases, and cardiovascular and metabolism distributed through retailers, wholesalers, distributors, hospitals, and healthcare professionals for prescription use.
Cheap or expensive? priced in line with its group
Its price-to-earnings (P/E) is 40.0 versus 41.7 for 4 direct peers — priced in line with its group.
Revenue is growing 6% versus the same quarter last year.
On analysts' next-year forecasts the multiple drops to 21.0 — they expect higher earnings.
The average analyst price target is 279.41, 6% above the current price (their view, not ours).
The stock sits at 83% of its one-year range (0% = the low, 100% = the high).
The risks
- No risk flags were detected from the data we have.
Strengths
- ✅ Profitable — 1 of every 100 dollars of revenue stays as profit.
- ✅ Generates free cash flow — profit becomes cash in the bank.
- ✅ Most analysts rate it buy (16 vs 1).
- ✅ Pays a dividend (2.0% a year).
What the market is talking about this week
Positive prostate-cancer trial data lifted the stock during an otherwise weak week for the market.
- Johnson & Johnson presented Phase 3 results: apalutamide before and after surgery cut the risk of prostate cancer recurrence or death by 62% versus surgery alone. [1]
- The same substudy showed a 51% lower risk of metastasis or death, and twice as many patients needed no further treatment after three years. [1]
- Apalutamide is currently approved for advanced prostate cancer; the perioperative use in earlier disease is still investigational and not approved. [1]
- A press report says a merger between Johnson & Johnson's orthopedics unit and Smith & Nephew collapsed over a leadership dispute; Smith & Nephew declined to comment. [6]
A summary of the articles below only, each point with its source. Not a forecast, not a recommendation.
What to watch
- Whether J&J files for regulatory approval of perioperative apalutamide — that is what would turn the trial data into revenue. [1]
- Publication of the manuscript in European Urology and physician reaction, which will show how widely the regimen is adopted. [1]
- Official clarification from the companies on the fate of the orthopedics merger with Smith & Nephew, so far based only on press reporting. [6]
- The next quarterly report: whether net income returns to a level consistent with $6.4bn of cash flow, after a quarter with only $210m.
What changed this week
Over the past week the stock rose 3.2% (for comparison: S&P 500 -0.4%, sector ETF XLV +1.4%).
The company published its quarterly report this week — see the plain-language summary above.
This week's news
- Johnson & Johnson announces ERLEADA® (apalutamide) treatment before and after surgery reduces risk of recurrence or death by 62% versus surgery alone in high-risk prostate cancer finance.yahoo.com · 2026-10-24
Company release: in a Phase 3 PROTEUS substudy, apalutamide plus hormone therapy before and after surgery cut recurrence or death risk by 62%; presented at ESMO 2026. source ↗ - Arrowhead Pharmaceuticals And 2 Biotech Stocks To Own finance.yahoo.com · 2026-10-24
A screening article about three biotech stocks (Arrowhead, Supernus and another) amid steady interest rates; it does not discuss Johnson & Johnson. source ↗ - Sector Update: Healthcare Stocks Fall Late Afternoon finance.yahoo.com · 2026-10-23
Short market wrap: healthcare stocks fell late Friday afternoon, with the NYSE Healthcare Index down 1.3%. The text is paywalled. source ↗ - Sector Update: Healthcare Stocks Decline Friday Afternoon finance.yahoo.com · 2026-10-23
An earlier version of the same wrap: the NYSE Healthcare Index was down 1.2% on Friday. Paywalled. source ↗ - European Stocks Close Lower in Friday Trading Amid Rising Oil Prices, 'Extraordinary Collapse' in UK Consumer Confidence finance.yahoo.com · 2026-10-23
European markets wrap: indexes closed lower amid rising oil prices and a slump in UK consumer confidence. Not directly about the company. source ↗ - Correction: Update: Market Chatter: Johnson & Johnson Orthopedics, Smith & Nephew Merger Collapsed Over Leadership Dispute finance.yahoo.com · 2026-10-23
Corrected market chatter item: a reported merger of J&J's orthopedics with Smith & Nephew collapsed over a leadership dispute; Smith & Nephew declined to comment. Paywalled. source ↗
What changed since last week
• New strength: positive free cash flow.
• The price rose 3.9% since the last summary.
A description of facts from the filings and the market — not investment advice or a recommendation. "Cheap" and "expensive" are always relative to the comparison group. Educational information only — not investment advice. Not a registered investment adviser or broker-dealer.