 TechAnalyzer Pro
Intuit Inc INTU
Stock research in plain language · As of Oct 25, 2026 · updated once a week, after the trading week closes
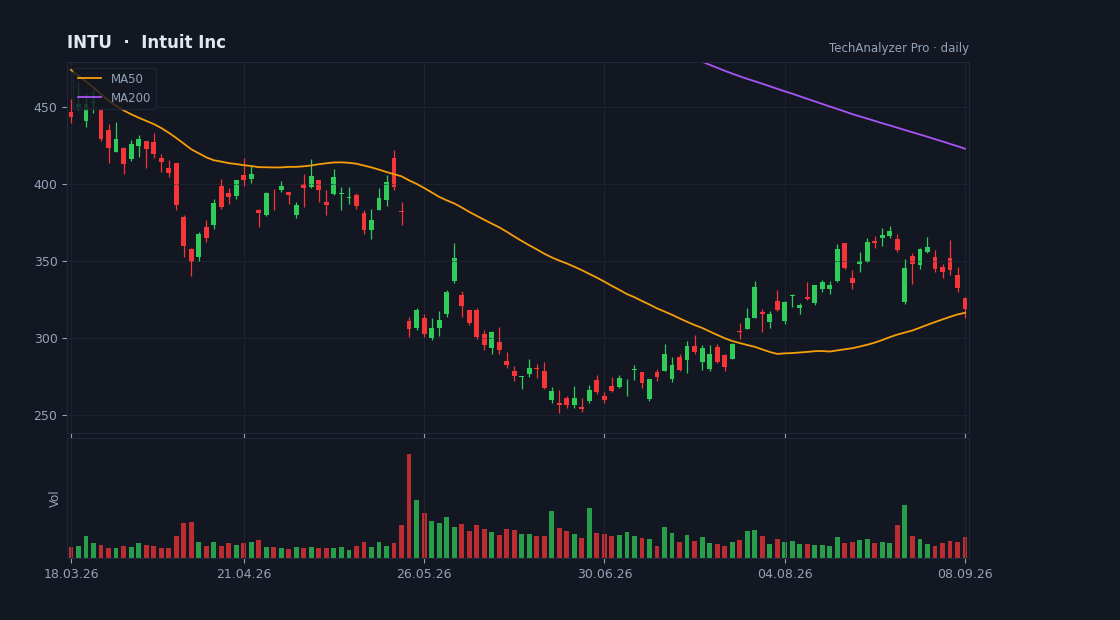
Daily candles, 50 and 200-day averages and volume · updated every trading day · click to open the live chart
What the company does
Intuit Inc is a large-cap company in the Technology sector (Software - Application), with a market value of $91.8B, based in the USA.
It employs about 18,600 people and has been listed since Mar 12, 1993.
Intuit Inc. provides financial management, payments and capital, compliance, and marketing products and services in the United States. The company operates in two segments: Global Business Solutions and Consumer.
Cheap or expensive? relatively cheap
Its price-to-earnings (P/E) is 20.9 versus 38.7 for the median of the Technology sector in our universe (65 companies) — relatively cheap.
Revenue is growing 14% versus the same quarter last year.
On analysts' next-year forecasts the multiple drops to 12.7 — they expect higher earnings.
The average analyst price target is 406.92, 18% above the current price (their view, not ours).
The stock sits at 22% of its one-year range (0% = the low, 100% = the high).
The risks
- • The stock is 49% below its one-year high.
Strengths
- ✅ Profitable — 8 of every 100 dollars of revenue stays as profit.
- ✅ Generates free cash flow — profit becomes cash in the bank.
- ✅ Buys back its shares (4% fewer shares in a year).
- ✅ Most analysts rate it buy (20 vs 2).
- ✅ Pays a dividend (1.4% a year).
What changed this week
Over the past week the stock rose 5.6% (for comparison: S&P 500 -0.4%, sector ETF XLK -0.1%).
This week's news
- Intuit (INTU) Suffers a Larger Drop Than the General Market: Key Insights finance.yahoo.com · 2026-10-23
What the article says
In the latest trading session, Intuit (INTU) closed at $343.39, marking a -3.24% move from the previous day. The stock's performance was behind the S&P 500's daily loss of 0.52%. Meanwhile, the Dow experienced a drop of 1.24%, and the technology-dominated Nasdaq saw a decrease of 0.21%. The stock of maker of TurboTax,… source ↗
- Broyhill is Upgrading Quality in Software: Moving from Intuit (INTU) to Microsoft finance.yahoo.com · 2026-10-23
What the article says
Broyhill Asset Management, a Charlotte-based firm, issued its third-quarter 2026 investor letter. The letter can be downloaded here. The Broyhill Equity Composite decreased by 0.3% in Q3, underperforming the MSCI All Country World Index, which gained 1.7%. For the first nine months of the year, the Composite returned… source ↗
- Intuit (INTU) vs. PYPL and XYZ: Can an 81% Gross Margin and $8.6B Free Cash Flow Justify a Rebound? finance.yahoo.com · 2026-10-22
What the article says
Is INTU a good stock to buy? We came across a bullish thesis on Intuit Inc. on Astute Optics - US's Substack. In this article, we will summarize the bulls' thesis on INTU. Intuit Inc.'s share was trading at $335.61as of October 21st 2026. INTU's trailing and forward P/E were 17.76 and 12.66 respectively according to… source ↗
- Coast Raises $35 Million to Build the Financial Platform for the Physical Economy finance.yahoo.com · 2026-10-22
What the article says
Round led by Thomvest Ventures, with new investors Intuit and Small World Capital NEW YORK, Oct. 22, 2026 /PRNewswire/ -- Coast, the financial platform built for the physical economy, today announced it has raised $35 million in new growth equity funding. The round was led by Thomvest Ventures and joined by new… source ↗
- The Zacks Analyst Blog Highlights Salesforce, S&P Global, Intuit, Kewaunee Scientific and Key Tronic finance.yahoo.com · 2026-10-22
What the article says
For Immediate Release Chicago, IL – October 22, 2026 – Zacks.com announces the list of stocks featured in the Analyst Blog. Every day the Zacks Equity Research analysts discuss the latest news and events impacting stocks and the financial markets. Stocks recently featured in the blog include: Salesforce, Inc. CRM, S&P… source ↗
- Intuit (INTU) Rolls Out Free Federal AI Tax Filing finance.yahoo.com · 2026-10-22
What the article says
Intuit (NasdaqGS:INTU) introduced an AI-powered Credit Karma Tax service offering free federal tax filing with real-time assistance. The new Credit Karma Tax product uses AI tools for error checks, refund optimisation and guidance on long-term financial planning. Aprio expanded its AI-focused advisory partnership with… source ↗
What changed since last week
• The price rose 5.6% since the last summary.
A description of facts from the filings and the market — not investment advice or a recommendation. "Cheap" and "expensive" are always relative to the comparison group. Educational information only — not investment advice. Not a registered investment adviser or broker-dealer.