 TechAnalyzer Pro
The Home Depot Inc HD
Stock research in plain language · As of Oct 25, 2026 · updated once a week, after the trading week closes
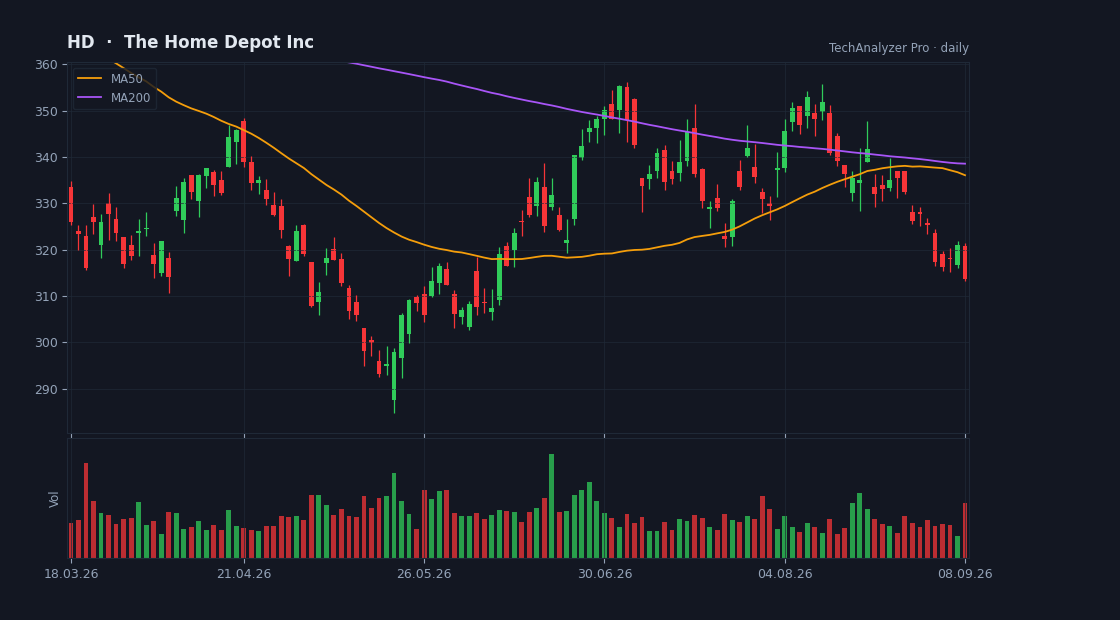
Daily candles, 50 and 200-day averages and volume · updated every trading day · click to open the live chart
What the company does
The Home Depot Inc is a mega-cap company in the Consumer Cyclical sector (Home Improvement Retail), with a market value of $319.1B, based in the USA.
It employs about 470,000 people and has been listed since Sep 22, 1981.
The Home Depot, Inc. operates as a home improvement retailer in the United States and internationally. It sells various building materials, home improvement products, lawn and garden products, and décor products, as well as facilities maintenance, repair, and operations products.
Cheap or expensive? priced in line with its group
Its price-to-earnings (P/E) is 21.5 versus 24.6 for the median of the Consumer Cyclical sector in our universe (21 companies) — priced in line with its group.
Revenue is growing 6% versus the same quarter last year.
On analysts' next-year forecasts the multiple drops to 20.6 — they expect higher earnings.
The average analyst price target is 379.75, 19% above the current price (their view, not ours).
The stock sits at 38% of its one-year range (0% = the low, 100% = the high).
The risks
- ⚠️ Net debt is 3.6× shareholders' equity — high leverage.
Strengths
- ✅ Profitable — 10 of every 100 dollars of revenue stays as profit.
- ✅ Generates free cash flow — profit becomes cash in the bank.
- ✅ Most analysts rate it buy (22 vs 0).
- ✅ Pays a dividend (1.4% a year).
What changed this week
Over the past week the stock rose 3.3% (for comparison: S&P 500 -0.4%, sector ETF XLY +0.6%).
This week's news
- Home Depot (HD) Earnings Revisions Bring Its Valuation Story Back Into Focus finance.yahoo.com · 2026-10-22
What the article says
Home Depot (HD) is back in focus after a cluster of signals, including positive earnings and revenue estimate revisions, a stock move above its 50 day average, and a business model shift toward distribution. Over the past year, Home Depot's share price has struggled, with the year to date move down 9.16% and the 1… source ↗
- The Home Depot Foundation Pledges $1 Billion to Veteran Causes by 2032 finance.yahoo.com · 2026-10-22
What the article says
Expanded commitment will develop and grow innovative housing solutions to help end veteran homelessness Key Facts: $1 Billion: The Home Depot Foundation's total commitment to veteran causes through 2032. $650+ Million: Invested since 2011, building and improving more than 70,000 veteran homes and facilities.… source ↗
- Blue-Chip Stock Just Crossed Over Historically Bullish Trendline finance.yahoo.com · 2026-10-21
What the article says
Home Depot Inc (NYSE:HD) stock is 0.2% lower to trade at $314.45 this afternoon, slated to snap a six-day winning streak as the shares loom just below $320. The home improvement stock bounced off its early October lows and enjoyed a bull gap that led to this past Monday's surge back above the 50-day moving average.… source ↗
- Home Depot (HD): Does Becoming a Bigger Distributor Change How the Stock Should Be Valued? finance.yahoo.com · 2026-10-21
What the article says
The Home Depot, Inc. (NYSE:HD) now combines 2,364 retail stores with more than 1,340 distribution locations. That broader network can capture more contractor spending, but it also brings different margins and funding requirements. With housing affordability restraining large renovation projects, investors need returns… source ↗
- Why Home Depot (HD) Outpaced the Stock Market Today finance.yahoo.com · 2026-10-20
What the article says
Home Depot (HD) closed at $315.06 in the latest trading session, marking a +1.67% move from the prior day. The stock outpaced the S&P 500's daily gain of 0.28%. On the other hand, the Dow registered a gain of 1.02%, and the technology-centric Nasdaq decreased by 0.02%. Shares of the home-improvement retailer have… source ↗
- Here is What to Know Beyond Why The Home Depot, Inc. (HD) is a Trending Stock finance.yahoo.com · 2026-10-20
What the article says
Home Depot (HD) has been one of the most searched-for stocks on Zacks.com lately. So, you might want to look at some of the facts that could shape the stock's performance in the near term. Over the past month, shares of this home-improvement retailer have returned +4.3%, compared to the Zacks S&P 500 composite's +0.7%… source ↗
What changed since last week
• The price rose 8.2% since the last summary.
A description of facts from the filings and the market — not investment advice or a recommendation. "Cheap" and "expensive" are always relative to the comparison group. Educational information only — not investment advice. Not a registered investment adviser or broker-dealer.