 TechAnalyzer Pro
Goldman Sachs Group Inc GS
Stock research in plain language · As of Oct 25, 2026 · updated once a week, after the trading week closes
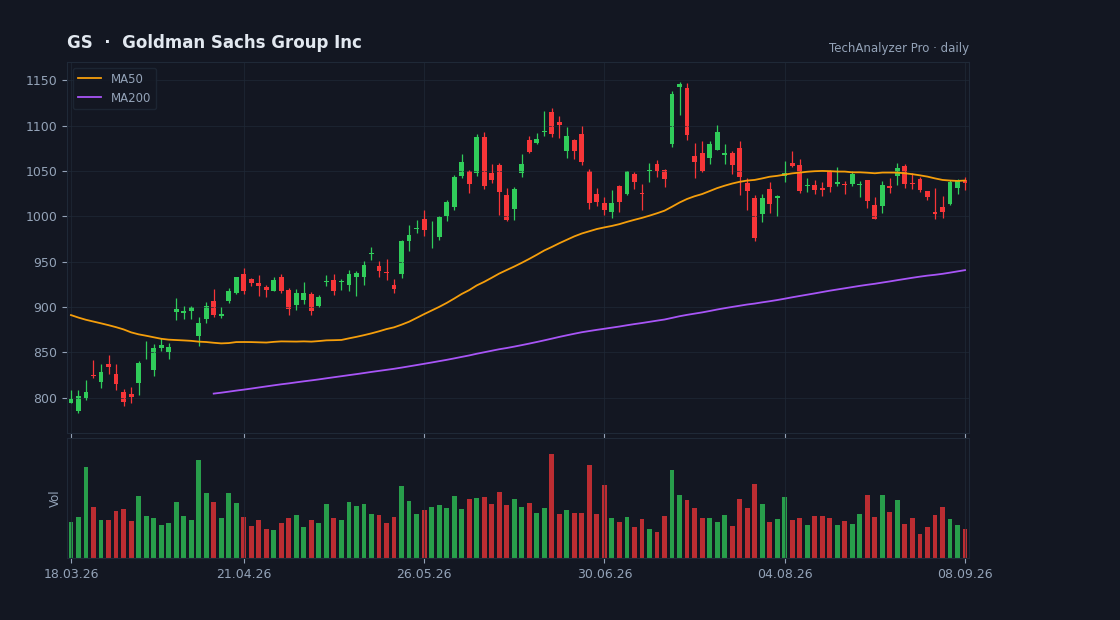
Daily candles, 50 and 200-day averages and volume · updated every trading day · click to open the live chart
What the company does
Goldman Sachs Group Inc is a mega-cap company in the Financial Services sector (Capital Markets), with a market value of $255.0B, based in the USA.
It employs about 47,500 people and has been listed since May 03, 1999.
The Goldman Sachs Group, Inc., a financial institution, provides a range of financial services for corporations, financial institutions, governments, and individuals in the Americas, Europe, the Middle East, Africa, and Asia. It operates through three segments: Global Banking & Markets, Asset & Wealth Management, and Platform Solutions. The Global Banking & Markets segment provides financial advisory services, including strategic advisory assignments related to mergers and acquisitions, divestitures, corporate defense activities, restructurings, and spin-offs; equity and debt underwriting of public offerings and private placements; relationship lending and acquisition financing; secured lending through structured credit and asset-backed lending, such as warehouse, residential and commercial mortgage, corporate, consumer, auto, and student loans; financing through securities purchased under agreements to resell; and commodity financing through structured transactions.
Cheap or expensive? priced in line with its group
Its price-to-earnings (P/E) is 12.6 versus 13.0 for 4 direct peers — priced in line with its group.
Revenue is growing 23% versus the same quarter last year.
The average analyst price target is 1031.14, 18% above the current price (their view, not ours).
The stock sits at 33% of its one-year range (0% = the low, 100% = the high).
The risks
- No risk flags were detected from the data we have.
Strengths
- ✅ Profitable — 14 of every 100 dollars of revenue stays as profit.
- ✅ Buys back its shares (4% fewer shares in a year).
- ✅ More cash than debt.
- ✅ Most analysts rate it buy (8 vs 2).
- ✅ Revenue is growing 23% a year.
- ✅ Pays a dividend (2.0% a year).
What changed this week
Over the past week the stock fell 0.6% (for comparison: S&P 500 -0.4%, sector ETF XLF +0.7%).
This week's news
- Goldman Sachs (GS) Stock Still Looks Reasonable On Its 223% Run finance.yahoo.com · 2026-10-24
What the article says
Goldman Sachs Group has delivered a powerful share price run over the past few years, and recent swings now put a sharper spotlight on whether that level still lines up with the returns it earns on its capital. With the stock giving back some ground in recent weeks, investors are asking if the current valuation fairly… source ↗
- Top Stock Reports for Apple, Berkshire Hathaway & Goldman Sachs finance.yahoo.com · 2026-10-23
What the article says
Friday, October 23, 2026 The Zacks Research Daily presents the best research output of our analyst team. Today's Research Daily features new research reports on 16 major stocks, including Apple Inc. (AAPL), Berkshire Hathaway Inc. (BRK.B) and The Goldman Sachs Group, Inc. (GS), as well a micro-cap stock SIFCO… source ↗
- Goldman Sachs raised to Buy at Freedom Broker seekingalpha.com · 2026-10-23
What the article says
[Goldman Sachs Expected To Cut Hundreds Of Jobs This Month] Michael M. Santiago/Getty Images News Goldman Sachs Group (GS [https://seekingalpha.com/symbol/GS]) was raised to Buy from Hold at Freedom Broker on delivering the second-best quarter on record. "Goldman Sachs (GS [https://seekingalpha.com/symbol/GS])… source ↗
- Goldman's Equities Revenues Jump 72% Y/Y in Q3: Can Growth Sustain? finance.yahoo.com · 2026-10-23
What the article says
The Goldman Sachs Group, Inc. GS delivered robust performance in its Equities business in the third quarter of 2026, benefiting from strong client activity, rising financing demand and strength in derivatives. Third-quarter Equities net revenues surged 72% year over year to $6.44 billion, marking the company's… source ↗
- Transaction in Own Shares finance.yahoo.com · 2026-10-23
What the article says
Transaction in Own Shares October 22, 2026 • • • • • • • • • • • • • • • • Shell plc (the 'Company') announces that on 22 October 2026 it purchased the following number of Shares for cancellation. Aggregated information on Shares purchased according to trading venue: Date of Purchase Number of Shares purchased Highest… source ↗
- General Motors (GM) Stock Sees Modest Fair Value Cut As Analysts Trim Targets finance.yahoo.com · 2026-10-23
What the article says
The analyst fair value estimate for General Motors has been trimmed from US$104.22 to US$101.22, a reduction of about 2.9%. This move aligns with recent Street research, where many analysts are cutting price targets while still pointing to potential execution on earnings, cash returns and margin efficiency. As you… source ↗
What changed since last week
• New strength: dividend.
A description of facts from the filings and the market — not investment advice or a recommendation. "Cheap" and "expensive" are always relative to the comparison group. Educational information only — not investment advice. Not a registered investment adviser or broker-dealer.