 TechAnalyzer Pro
Alphabet Inc Class C GOOG
Stock research in plain language · As of Oct 25, 2026 · updated once a week, after the trading week closes
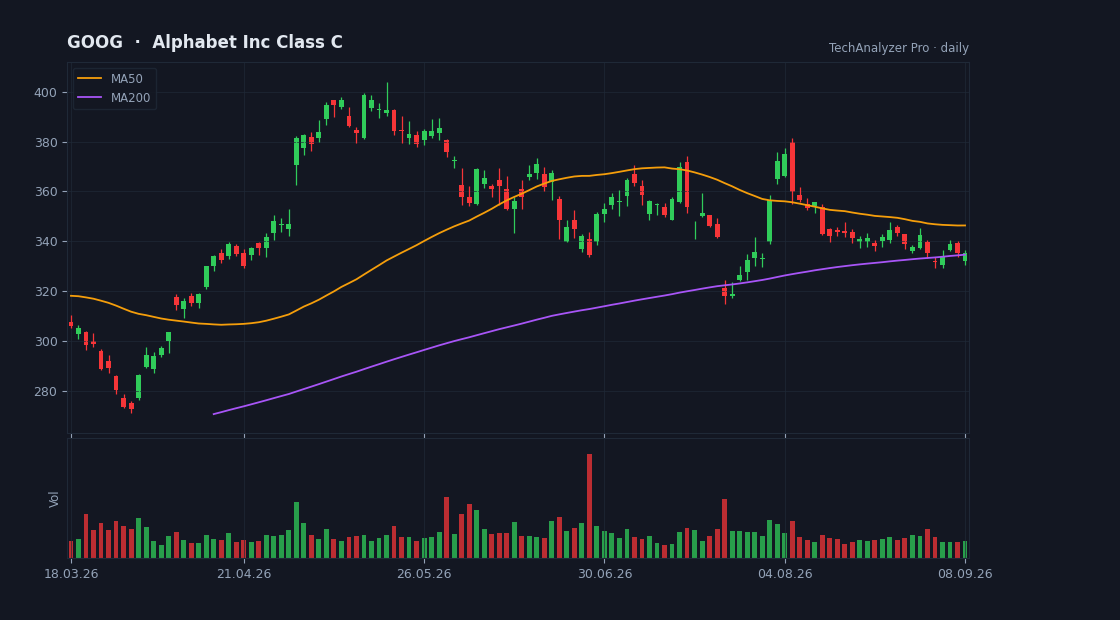
Daily candles, 50 and 200-day averages and volume · updated every trading day · click to open the live chart
The bottom line
The stock trades near $317, about 38% up its 52-week range, after falling 5.8% in a week versus 0.4% for the S&P 500 and 4.4% for the sector. Last quarter showed $119.8B revenue, 24.2% year-over-year growth and EPS of $9.11 against a $2.88 estimate, but free cash flow was negative $5.9B. A P/E of 15.9 sits close to the sector median of 15.5, so the price does not embed a large premium to peers. The central tension is growth and a $242B cash pile against heavy AI capital spending that is weighing on cash flow — the very issue that hit other sector stocks this week.
An explanation of the mechanics from the facts on this page, not advice.
What the company does
Alphabet Inc Class C is a mega-cap company in the Communication Services sector (Internet Content & Information), with a market value of $3.88T, based in the USA.
It employs about 198,933 people and has been listed since Apr 03, 2014.
Alphabet Inc. offers various products and platforms in the United States, Europe, the Middle East, Africa, the Asia-Pacific, Canada, and Latin America. It operates through Google Services, Google Cloud, and Other Bets segments.
Cheap or expensive? priced in line with its group
Its price-to-earnings (P/E) is 15.9 versus 15.5 for the median of the Communication Services sector in our universe (18 companies) — priced in line with its group.
Revenue is growing 24% versus the same quarter last year.
On analysts' next-year forecasts the multiple rises to 23.4 — they expect lower earnings.
The average analyst price target is 422.36, 33% above the current price (their view, not ours).
The stock sits at 38% of its one-year range (0% = the low, 100% = the high).
The risks
- • More cash leaves than comes in (negative free cash flow).
- • Quarterly report in 3 days (2026-10-28) — a day the stock can move a lot.
Strengths
- ✅ Profitable — 94 of every 100 dollars of revenue stays as profit.
- ✅ More cash than debt.
- ✅ Most analysts rate it buy (56 vs 0).
- ✅ Revenue is growing 24% a year.
- ✅ Pays a dividend (0.3% a year).
What the market is talking about this week
Ahead of the October 28 report, the stock fell with its sector as the market scrutinizes Big Tech's AI spending.
- Alphabet reports quarterly results in the coming week alongside Amazon, in a heavy week that also includes a Fed meeting and preelection positioning. [3] [4]
- In communication services all five companies reporting this week beat profit estimates, yet Netflix, Meta and AT&T shares fell sharply after their reports. [2] [4]
- Meta raised the low end of its 2026 capital spending to $135B-$145B, sharpening investor focus on Big Tech's AI spending. [2] [4]
- An article on Intel cites Google's multi-million TPU order as one of the deals that signaled real foundry demand. [5]
- Critic Ed Zitron argued private AI firms have become "load-bearing" for Alphabet, Microsoft and Amazon, and that the data-center build-out is overdone. [1]
A summary of the articles below only, each point with its source. Not a forecast, not a recommendation.
What to watch
- The October 28 earnings report: revenue, profit and capital spending will show whether the 24.2% growth pace continues. (2026-10-28)
- Whether free cash flow returns to positive after negative $5.9B last quarter. (2026-10-28)
- Investor reaction to AI capital spending, after Meta and Netflix fell sharply despite beating estimates. [2] [4]
- The Fed meeting the same week, which can move technology stocks broadly. [3]
What changed this week
Over the past week the stock fell 5.8% (for comparison: S&P 500 -0.4%, sector ETF XLC -4.4%).
This week's news
- AI bear slams Nvidia's GPU pitch: 'There's not scarcity other than that which is created by Jensen Huang' finance.yahoo.com · 2026-10-24
AI-boom critic Ed Zitron attacked Nvidia for manufacturing chip scarcity and argued private AI firms have become critical to Alphabet, Microsoft and Amazon. source ↗ - Earnings Scoreboard: 82% firms beat EPS estimates, 79% post Y/Y earnings growth seekingalpha.com · 2026-10-24
Earnings roundup: of 76 S&P 500 companies reporting this week, 82% beat profit estimates and 63% beat revenue estimates. source ↗ - Stock Market Action Plan: A Preelection Week Primer finance.yahoo.com · 2026-10-24
A market preview flags a heavy week with Alphabet and Amazon earnings, a Fed meeting and preelection positioning. source ↗ - 5 out of 5 communications services stocks deliver EPS wins this week: Earnings Scorecard seekingalpha.com · 2026-10-24
All five communication services names reporting this week beat EPS estimates; Alphabet, Verizon and T-Mobile report next week. source ↗ - What Investors Overlooked Before Intel's 127% Run finance.yahoo.com · 2026-10-24
A retrospective on Intel cites Google's multi-million-unit TPU order as evidence of real demand for Intel's foundry. source ↗ - Marissa Mayer studied AI in the ’90s before joining Google finance.yahoo.com · 2026-10-24
Former Google executive Marissa Mayer described at a conference how she studied artificial intelligence in the 1990s before joining Google. source ↗
What changed since last week
• The price fell 5.8% since the last summary.
A description of facts from the filings and the market — not investment advice or a recommendation. "Cheap" and "expensive" are always relative to the comparison group. Educational information only — not investment advice. Not a registered investment adviser or broker-dealer.