 TechAnalyzer Pro
General Motors Company GM
Stock research in plain language · As of Oct 25, 2026 · updated once a week, after the trading week closes
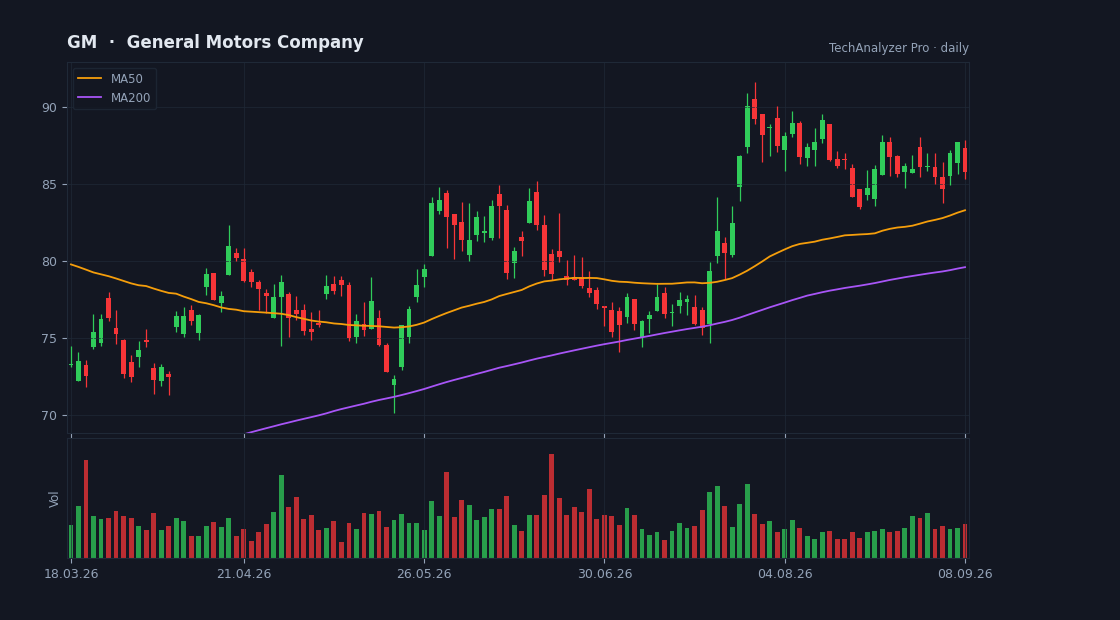
Daily candles, 50 and 200-day averages and volume · updated every trading day · click to open the live chart
What the company does
General Motors Company is a large-cap company in the Consumer Cyclical sector (Auto Manufacturers), with a market value of $66.6B, based in the USA.
It employs about 156,000 people and has been listed since Nov 18, 2010.
General Motors Company designs, builds, and sells trucks, crossovers, cars, and automobile parts worldwide. It operates through GM North America, GM International, and GM Financial segments. The company markets its vehicles primarily under the Buick, Cadillac, Chevrolet, GMC, Baojun, and Wuling brand names.
Cheap or expensive? priced in line with its group
Price-to-earnings (p/e): 16.6. We have no good comparison group for this stock, so the number stands alone.
Revenue is growing 3% versus the same quarter last year.
On analysts' next-year forecasts the multiple drops to 6.1 — they expect higher earnings.
The average analyst price target is 101.00, 33% above the current price (their view, not ours).
The stock sits at 38% of its one-year range (0% = the low, 100% = the high).
The risks
- • Net debt is 1.6× shareholders' equity — high leverage.
Strengths
- ✅ Profitable — 7 of every 100 dollars of revenue stays as profit.
- ✅ Generates free cash flow — profit becomes cash in the bank.
- ✅ Buys back its shares (9% fewer shares in a year).
- ✅ Most analysts rate it buy (20 vs 0).
- ✅ Pays a dividend (0.9% a year).
What changed this week
Over the past week the stock fell 9.6% (for comparison: S&P 500 -0.4%, sector ETF XLY +0.6%).
The company published its quarterly report this week — see the plain-language summary above.
This week's news
- Earnings Scoreboard: 82% firms beat EPS estimates, 79% post Y/Y earnings growth seekingalpha.com · 2026-10-24
What the article says
[Top view image of text THIRD QUARTER on office desk.] mohd izzuan Earnings season gathered momentum during the last week, with 76 S&P 500 companies reporting results across key sectors, including Financials, Communication Services, Consumer Discretionary, Industrials, and Energy. The results offered a fresh look at… source ↗
- SA Asks: How can General Motors get back on track? seekingalpha.com · 2026-10-24
What the article says
[General Motors Lowers Its Growth Expectations Amid Steel And Aluminum Tariffs] Justin Sullivan Shares of General Motors (GM [https://seekingalpha.com/symbol/GM]) slid significantly this week after the legacy automaker released a weaker-than-expected forecast, fanning concerns about the company's rising costs and… source ↗
- Consumer Discretionary Earnings: EPS beats outpace revenue seekingalpha.com · 2026-10-24
What the article says
[Consumer Discretionary Apparel Stock Market Industry Sector Wall Street Buildings 3d Illustration] iQoncept/iStock via Getty Images Consumer discretionary companies delivered stronger results against EPS expectations than revenue estimates this week. Six of nine beat on earnings, but only four topped revenue… source ↗
- Ford, GM, Stellantis stocks decline for week ending Oct. 23 finance.yahoo.com · 2026-10-24
What the article says
GM's stock price dropped the same week it reported earnings and announced a $20 billion stock buyback. Video Transcript 00:01 Speaker A Ford Motor Company, General Motors and Jeep parent Stellantis all saw their stock prices drop for the week ending Friday October 23rd. 00:08 Speaker A The share price decline came the… source ↗
- General Motors (GM) Unveiled A $20b Buyback, Is The Stock Still A Bargain? finance.yahoo.com · 2026-10-23
What the article says
General Motors (GM) just paired a strong third quarter earnings report with a fresh US$20b share repurchase program, while also flagging higher costs that could pressure margins into 2027 and temper investor enthusiasm. That backdrop helps explain why General Motors shares have retreated in the short term, with the 7… source ↗
- Sector Update: Consumer Stocks Fall Friday Afternoon finance.yahoo.com · 2026-10-23
What the article says
Consumer stocks were lower Friday afternoon, with the State Street Consumer Staples Select Sector SP PREMIUM Upgrade to read this MT Newswires article and get so much more. A Silver or Gold subscription plan is required to access premium news articles. Upgrade Already have a subscription? Sign in source ↗
What changed since last week
• Risk flag cleared: earnings report coming up.
• The price fell 9.6% since the last summary.
• The average analyst target moved from 104.17 to 101.00.
• A new quarterly report was published (quarter ended Sep 30, 2026).
A description of facts from the filings and the market — not investment advice or a recommendation. "Cheap" and "expensive" are always relative to the comparison group. Educational information only — not investment advice. Not a registered investment adviser or broker-dealer.