 TechAnalyzer Pro
General Dynamics Corporation GD
Stock research in plain language · As of Oct 25, 2026 · updated once a week, after the trading week closes
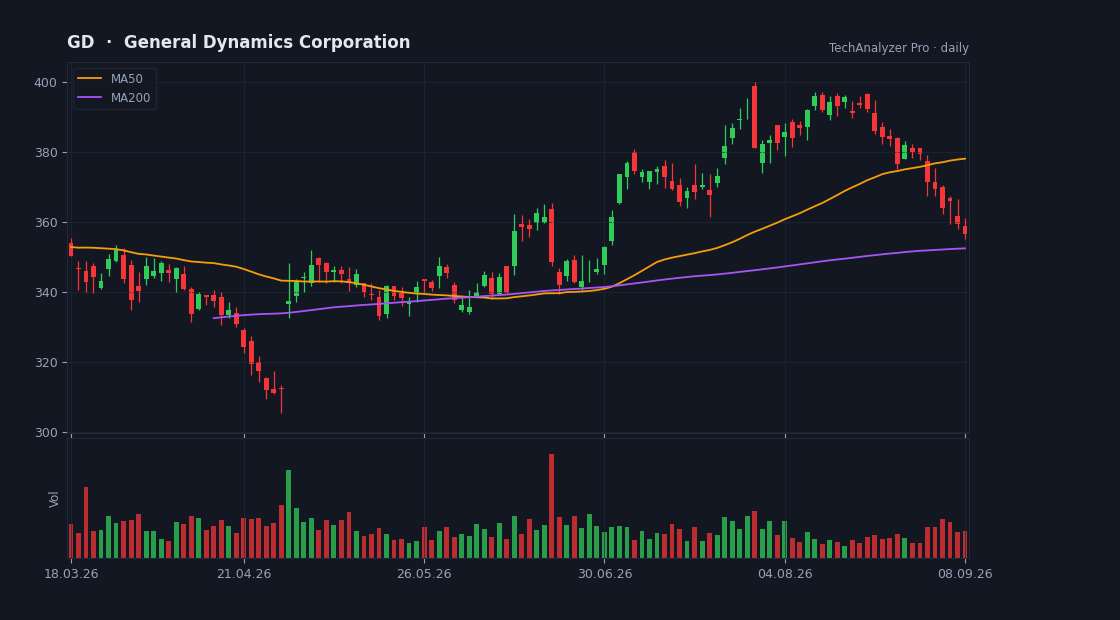
Daily candles, 50 and 200-day averages and volume · updated every trading day · click to open the live chart
What the company does
General Dynamics Corporation is a large-cap company in the Industrials sector (Aerospace & Defense), with a market value of $94.5B, based in the USA.
It employs about 117,000 people and has been listed since Jan 03, 1977.
General Dynamics Corporation operates as an aerospace and defense company worldwide. It operates through four segments: Aerospace, Marine Systems, Combat Systems, and Technologies. The Aerospace segment produces and sells business jets; and offers aircraft maintenance and repair, management, aircraft-on-ground support, customer support and custom completion services, modifications, upgrades, and lifecycle sustainment support services.
Cheap or expensive? priced in line with its group
Its price-to-earnings (P/E) is 21.3 versus 26.3 for 4 direct peers — priced in line with its group.
Revenue is growing 8% versus the same quarter last year.
On analysts' next-year forecasts the multiple drops to 18.5 — they expect higher earnings.
The average analyst price target is 406.78, 16% above the current price (their view, not ours).
The stock sits at 48% of its one-year range (0% = the low, 100% = the high).
The risks
- • Quarterly report in 5 days (2026-10-30) — a day the stock can move a lot.
Strengths
- ✅ Profitable — 8 of every 100 dollars of revenue stays as profit.
- ✅ Generates free cash flow — profit becomes cash in the bank.
- ✅ Most analysts rate it buy (14 vs 1).
- ✅ Pays a dividend (1.8% a year).
What changed this week
Over the past week the stock rose 1.5% (for comparison: S&P 500 -0.4%, sector ETF XLI -1.9%).
This week's news
- General Dynamics (GD) Wins Navy Electronics Attack Unit Production Contract finance.yahoo.com · 2026-10-24
What the article says
General Dynamics (NYSE:GD) unit General Dynamics Mission Systems has been selected to produce Next Generation Electronics Attack Units for the U.S. Navy. The award supports the EA-18G Growler Block II modernization program and includes long term sustainment responsibilities. The contract extends production and support… source ↗
- Amy Johnson Appointed President of GDIT finance.yahoo.com · 2026-10-23
What the article says
RESTON, Va., Oct. 23, 2026 /PRNewswire/ -- General Dynamics (NYSE:GD) announced today that Amy Johnson has been appointed as president of GDIT, effective November 3.Amy Johnson Appointed President of GDIT Johnson is a 27-year veteran of General Dynamics Mission Systems, where she held increasingly senior roles in… source ↗
- General Dynamics (GD) Earnings Expected to Grow: What to Know Ahead of Next Week's Release finance.yahoo.com · 2026-10-23
What the article says
The market expects General Dynamics (GD) to deliver a year-over-year increase in earnings on higher revenues when it reports results for the quarter ended September 2026. This widely-known consensus outlook is important in assessing the company's earnings picture, but a powerful factor that might influence its… source ↗
- Lockheed Q3 Earnings Beat Estimates, Sales Increase Year Over Year finance.yahoo.com · 2026-10-22
What the article says
Lockheed Martin Corporation LMT reported third-quarter 2026 adjusted earnings of $7.97 per share, which beat the Zacks Consensus Estimate of $7.49 by 6.4%. The bottom line increased 14.7% from the year-ago quarter's reported figure of $6.95. Operational Highlights of Lockheed Net sales were $20.71 billion, which beat… source ↗
- Hexcel Q3 Earnings Surpass Estimates, Revenues Improve Y/Y finance.yahoo.com · 2026-10-22
What the article says
Hexcel Corporation HXL reported third-quarter 2026 adjusted earnings of 50 cents per share, which improved 35.1% from the year-ago quarter's figure of 37 cents. The bottom line also surpassed the Zacks Consensus Estimate of 48 cents by 4.2%. The company reported GAAP earnings of 50 cents per share, which surpassed the… source ↗
- Boeing Stock Before Q3 Earnings Release: To Buy or Not to Buy? finance.yahoo.com · 2026-10-22
What the article says
The Boeing Company BA is expected to report third-quarter 2026 results on Oct. 27, before market open. The Zacks Consensus Estimate for earnings is pegged at a loss of 21 cents per share. The Zacks Consensus Estimate for revenues is pinned at $24.53 billion, indicating growth of 5.4% from the year-ago reported… source ↗
What changed since last week
No material change: same valuation verdict, same risk flags, price moved less than 3%.
A description of facts from the filings and the market — not investment advice or a recommendation. "Cheap" and "expensive" are always relative to the comparison group. Educational information only — not investment advice. Not a registered investment adviser or broker-dealer.