 TechAnalyzer Pro
Diamondback Energy Inc FANG
Stock research in plain language · As of Oct 25, 2026 · updated once a week, after the trading week closes
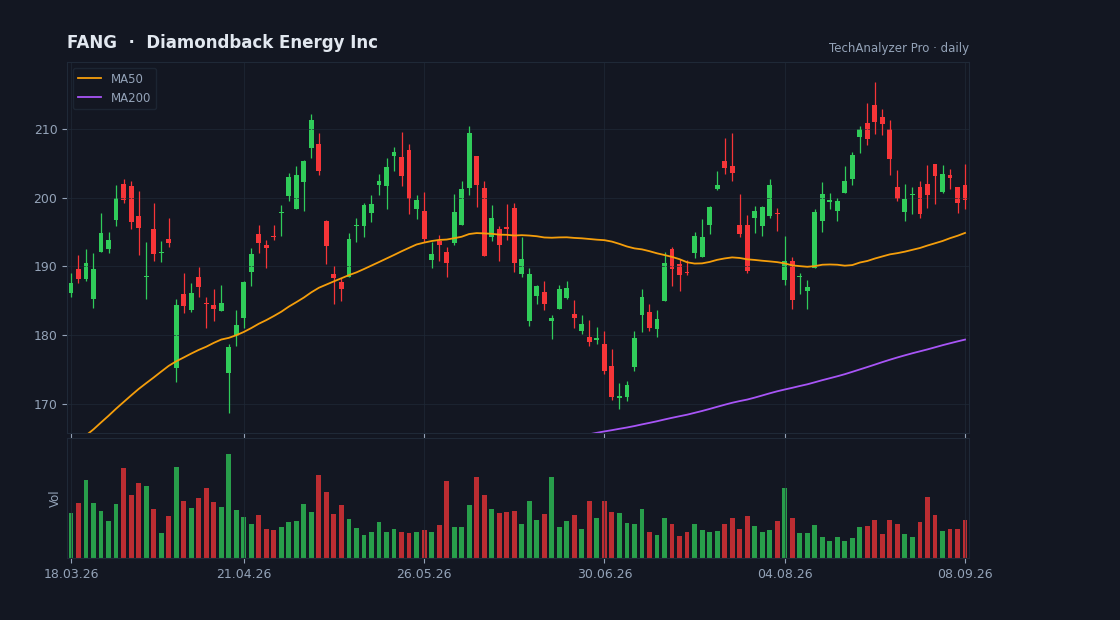
Daily candles, 50 and 200-day averages and volume · updated every trading day · click to open the live chart
What the company does
Diamondback Energy Inc is a large-cap company in the Energy sector (Oil & Gas E&P), with a market value of $57.9B, based in the USA.
It employs about 1,762 people and has been listed since Oct 12, 2012.
Diamondback Energy, Inc., an independent oil and natural gas company, acquires, develops, explores, and exploits unconventional, onshore oil and natural gas reserves in the Permian Basin in West Texas, the United States. The company primarily focuses on the development of the Spraberry and Wolfcamp formations of the Midland Basin; and the Wolfcamp and Bone Spring formations of the Delaware Basin, both of which are part of the Permian Basin in West Texas and New Mexico. Diamondback Energy, Inc.
Cheap or expensive? relatively expensive
Its price-to-earnings (P/E) is 39.2 versus 22.4 for the median of the Energy sector in our universe (5 companies) — relatively expensive.
Revenue is growing 52% a year — the market is paying ahead for that growth. If it slows, the high multiple becomes the risk.
On analysts' next-year forecasts the multiple drops to 11.7 — they expect higher earnings.
The average analyst price target is 238.24, 16% above the current price (their view, not ours).
The stock sits at 87% of its one-year range (0% = the low, 100% = the high).
The risks
- • Quarterly report in 8 days (2026-11-02) — a day the stock can move a lot.
Strengths
- ✅ Profitable — 34 of every 100 dollars of revenue stays as profit.
- ✅ Generates free cash flow — profit becomes cash in the bank.
- ✅ Buys back its shares (4% fewer shares in a year).
- ✅ Most analysts rate it buy (27 vs 0).
- ✅ Revenue is growing 52% a year.
- ✅ Pays a dividend (2.2% a year).
What changed this week
Over the past week the stock rose 0.9% (for comparison: S&P 500 -0.4%, sector ETF XLE +1.6%).
This week's news
- Oil Stocks: Values or Traps? finance.yahoo.com · 2026-10-23
What the article says
(0:20) - Is Now A Good Time To Invest Into Oil Stocks? (4:45) - Breaking Down The Oil Industry And Its Current Performance (19:30) - Tracey's Top Stock Picks For Your Watchlist (49:30) - Episode Roundup: EC, BP, DVN, SM, FANG Podcast@zacks.com Welcome to Episode #458 of the Value Investor Podcast. Every week, Tracey… source ↗
- Dollar General and Las Vegas Sands have been highlighted as Zacks Bull and Bear of the Day finance.yahoo.com · 2026-10-23
What the article says
For Immediate Release Chicago, IL – October 23, 2026 – Zacks Equity Research shares Dollar General Corp. DG as the Bull of the Day and Las Vegas Sands Corp. LVS as the Bear of the Day. In addition, Zacks Equity Research provides analysis on Chevron Corp. CVX, Diamondback Energy, Inc. FANG and APA Corp. APA. Here is a… source ↗
- Diamondback Energy (FANG) Declines More Than Market: Some Information for Investors finance.yahoo.com · 2026-10-22
What the article says
Diamondback Energy (FANG) ended the recent trading session at $197.14, demonstrating a -1.89% change from the preceding day's closing price. This change lagged the S&P 500's daily loss of 1.21%. Meanwhile, the Dow gained 0.02%, and the Nasdaq, a tech-heavy index, lost 2.6%. Shares of the energy exploration and… source ↗
- Oil Prices Are Rising Which Oil And Gas Stocks Deserve A Closer Look finance.yahoo.com · 2026-10-22
What the article says
Oil prices jumping back toward triple digits after attacks on Saudi infrastructure and ships in the Persian Gulf have pushed geopolitical risk from background noise to front page. That kind of stress can reshape cash flows, balance sheets, and dividends across integrated oil & gas producers. This piece walks through… source ↗
- U.S. shale E&P stocks Q2 highlights: Diamondback Energy (NASDAQ:FANG) finance.yahoo.com · 2026-10-22
What the article says
U.S. shale E&P stocks Q2 highlights: Diamondback Energy (NASDAQ:FANG) Quarterly earnings results are a good time to check in on a company's progress, especially compared to its peers in the same sector. Today we are looking at Diamondback Energy (NASDAQ:FANG) and the best and worst performers in the u.s. shale e&p… source ↗
- Oil Prices Climb: 3 Energy Stocks Poised to Benefit From the Rally finance.yahoo.com · 2026-10-22
What the article says
Crude oil prices have climbed amid geopolitical tensions in the Middle East and concerns about global supply disruptions. Higher oil prices can support revenues, earnings and cash flow for exploration and production companies. However, the benefits depend on production volumes, operating costs, hedging strategies and… source ↗
What changed since last week
• New risk flag: earnings report coming up.
A description of facts from the filings and the market — not investment advice or a recommendation. "Cheap" and "expensive" are always relative to the comparison group. Educational information only — not investment advice. Not a registered investment adviser or broker-dealer.