 TechAnalyzer Pro
Duke Energy Corporation DUK
Stock research in plain language · As of Oct 25, 2026 · updated once a week, after the trading week closes
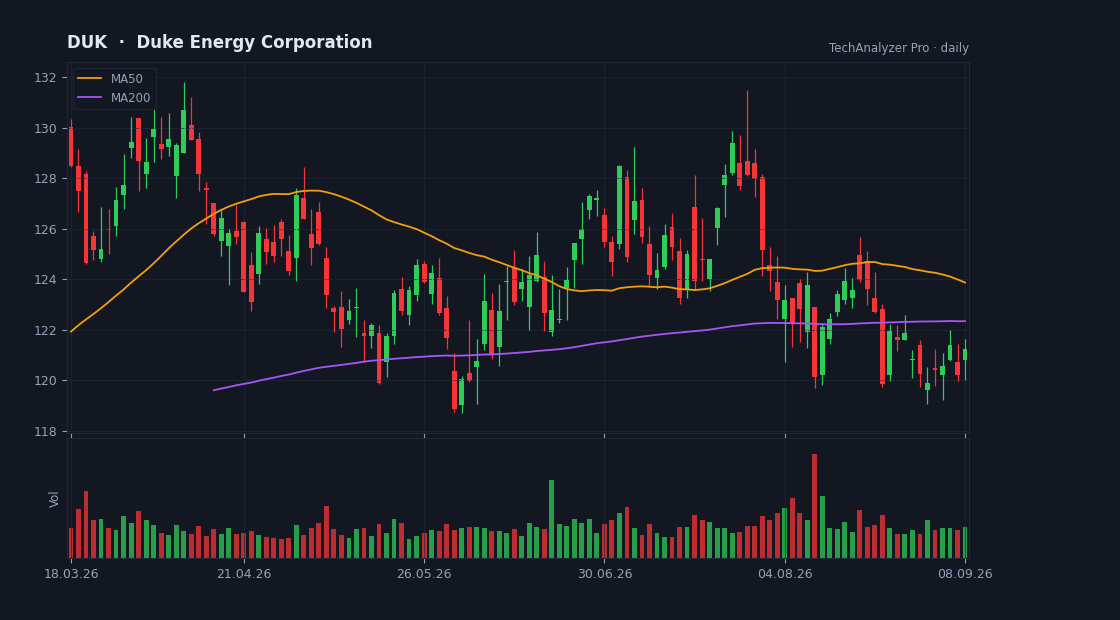
Daily candles, 50 and 200-day averages and volume · updated every trading day · click to open the live chart
What the company does
Duke Energy Corporation is a large-cap company in the Utilities sector (Utilities - Regulated Electric), with a market value of $97.4B, based in the USA.
It employs about 26,441 people and has been listed since Apr 06, 1983.
Duke Energy Corporation, through its subsidiaries, operates as an energy company in the United States. The company operates through two segments: Electric Utilities and Infrastructure (EU&I); and Gas Utilities and Infrastructure (GU&I). The EU&I segment generates, transmits, distributes, and sells electricity to customers in the Southeast and Midwest regions.
Cheap or expensive? priced in line with its group
Its price-to-earnings (P/E) is 18.9 versus 22.4 for the median of the Utilities sector in our universe (9 companies) — priced in line with its group.
Revenue is growing 1% versus the same quarter last year.
On analysts' next-year forecasts the multiple drops to 16.7 — they expect higher earnings.
The average analyst price target is 132.11, 6% above the current price (their view, not ours).
The stock sits at 66% of its one-year range (0% = the low, 100% = the high).
The risks
- • More cash leaves than comes in (negative free cash flow).
- • Net debt is 1.7× shareholders' equity — high leverage.
- • Quarterly report in 11 days (2026-11-05) — a day the stock can move a lot.
Strengths
- ✅ Profitable — 14 of every 100 dollars of revenue stays as profit.
- ✅ Most analysts rate it buy (12 vs 0).
- ✅ Pays a dividend (3.4% a year).
What changed this week
Over the past week the stock rose 2.9% (for comparison: S&P 500 -0.4%, sector ETF XLU +0.8%).
This week's news
- Duke Energy (DUK) Stock Could Be 19% Overvalued Despite Data Center Cost Deal finance.yahoo.com · 2026-10-22
What the article says
Duke Energy has delivered a 3 year share price gain that is hard to ignore, yet the real question for investors is whether today's US$120.67 price lines up with the dividend stream that underpins the stock. With income still a central reason many people own utilities, the focus now turns to what that payout really… source ↗
- PG&E (PCG) Misses Q3 Earnings and Revenue Estimates finance.yahoo.com · 2026-10-22
What the article says
PG&E (PCG) came out with quarterly earnings of $0.41 per share, missing the Zacks Consensus Estimate of $0.42 per share. This compares to earnings of $0.5 per share a year ago. These figures are adjusted for non-recurring items. This quarterly report represents an earnings surprise of -2.38%. A quarter ago, it was… source ↗
- Duke Energy lineworkers earn six awards at International Lineman's Rodeo, showcasing the skills that deliver safe, reliable service to customers finance.yahoo.com · 2026-10-21
What the article says
Rodeo highlights the skills Duke Energy lineworkers use every day to maintain and upgrade the grid, restore service after storms and outages and support growing communities CHARLOTTE, N.C., Oct. 21, 2026 /PRNewswire/ -- Duke Energy teams earned six awards at the International Lineman's Rodeo, one of the world's… source ↗
- GE Vernova Highlights Spain's Path to Reliable, Net-Zero Electricity finance.yahoo.com · 2026-10-21
What the article says
GE Vernova GEV is highlighting how Spain can transition toward a net-zero electricity system by 2050 without compromising power reliability or affordability. The company outlined four potential pathways for Spain's electricity system, emphasizing the importance of balancing renewable energy expansion with grid… source ↗
- Duke Energy Corporation (DUK) is Attracting Investor Attention: Here is What You Should Know finance.yahoo.com · 2026-10-21
What the article says
Duke Energy (DUK) has been one of the most searched-for stocks on Zacks.com lately. So, you might want to look at some of the facts that could shape the stock's performance in the near term. Over the past month, shares of this electric utility have returned +4.3%, compared to the Zacks S&P 500 composite's +0.7%… source ↗
- Duke Energy (DUK) Laps the Stock Market: Here's Why finance.yahoo.com · 2026-10-20
What the article says
Duke Energy (DUK) ended the recent trading session at $121.33, demonstrating a +1.73% change from the preceding day's closing price. The stock's change was more than the S&P 500's daily gain of 0.28%. Meanwhile, the Dow gained 1.02%, and the Nasdaq, a tech-heavy index, lost 0.02%. The electric utility's shares have… source ↗
What changed since last week
• New risk flag: earnings report coming up.
A description of facts from the filings and the market — not investment advice or a recommendation. "Cheap" and "expensive" are always relative to the comparison group. Educational information only — not investment advice. Not a registered investment adviser or broker-dealer.