 TechAnalyzer Pro
Comcast Corp CMCSA
Stock research in plain language · As of Oct 25, 2026 · updated once a week, after the trading week closes
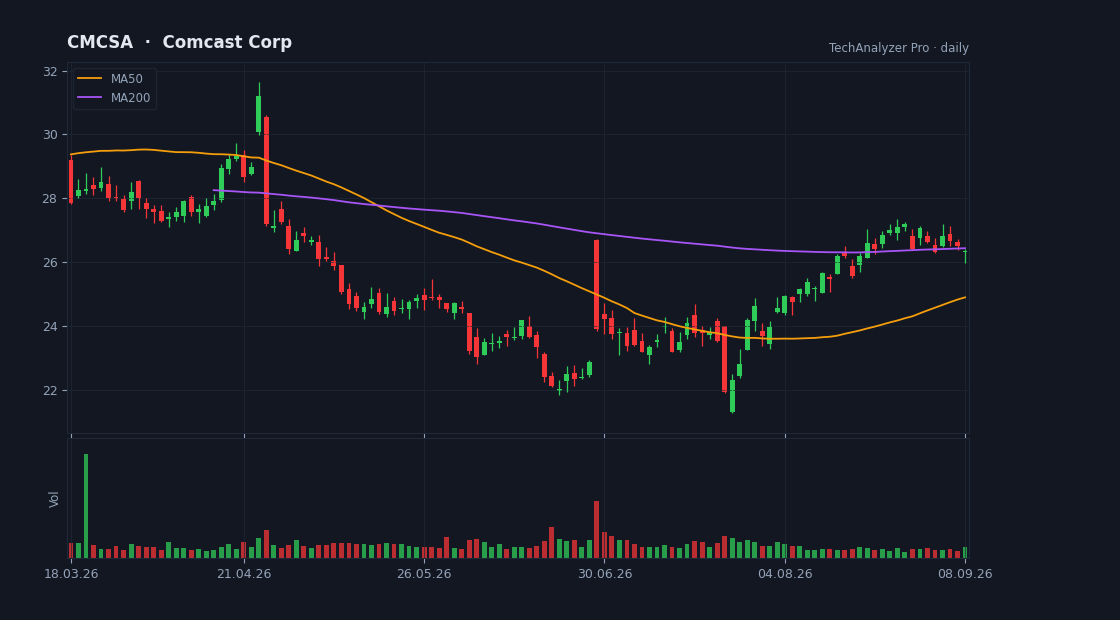
Daily candles, 50 and 200-day averages and volume · updated every trading day · click to open the live chart
What the company does
Comcast Corp is a large-cap company in the Communication Services sector (Telecom Services), with a market value of $80.5B, based in the USA.
It employs about 179,000 people and has been listed since Jun 29, 1972.
Comcast Corporation operates as a media and technology company worldwide. The company operates through Residential Connectivity & Platforms, Business Services Connectivity, Media, Studios, and Theme Parks segments. Its Residential Connectivity & Platforms segment provides residential broadband and wireless connectivity services, residential and business video services, sky-branded entertainment television networks, and advertising.
Cheap or expensive? relatively cheap
Its price-to-earnings (P/E) is 7.2 versus 12.2 for 3 direct peers — relatively cheap.
Revenue is shrinking 6% versus the same quarter last year.
On analysts' next-year forecasts the multiple drops to 6.0 — they expect higher earnings.
The average analyst price target is 28.16, 24% above the current price (their view, not ours).
The stock sits at 20% of its one-year range (0% = the low, 100% = the high).
The risks
- No risk flags were detected from the data we have.
Strengths
- ✅ Profitable — 12 of every 100 dollars of revenue stays as profit.
- ✅ Generates free cash flow — profit becomes cash in the bank.
- ✅ Buys back its shares (5% fewer shares in a year).
- ✅ Pays a dividend (1.4% a year).
What changed this week
Over the past week the stock rose 3.6% (for comparison: S&P 500 -0.4%, sector ETF XLC -4.4%).
The company published its quarterly report this week — see the plain-language summary above.
This week's news
- Comcast (CMCSA) Stock Faces Q3 Earnings Margin Crunch finance.yahoo.com · 2026-10-24
What the article says
Comcast just slipped 0.7% to US$22.69 in the first full trading session after reporting Q3 2026, a muted share reaction to earnings that were anything but quiet. The headline story is profit pressure. Net margin on a trailing 12 month view now sits at 9.2%, well below the 18.3% level a year earlier, even as free cash… source ↗
- Comcast (CMCSA) Stock May Be A Bargain Following Its Planned Split finance.yahoo.com · 2026-10-23
What the article says
Comcast has seen its share price under pressure in recent years, and a fresh round of restructuring plans has pushed investors to focus squarely on whether the current US$22.84 quote is properly supported by its earnings power. With the stock still reacting to shifting expectations around broadband, media and future… source ↗
- CMCSA Q3 2026 deep dive: cost transformation and wireless offset broadband softness finance.yahoo.com · 2026-10-23
What the article says
CMCSA Q3 2026 deep dive: cost transformation and wireless offset broadband softness Telecommunications and media company Comcast (NASDAQ:CMCSA) met Wall Street's revenue expectations in Q3 2026, but sales were flat year on year at $29.3 billion. Its non-GAAP profit of $1.07 per share was 8.6% above analysts' consensus… source ↗
- CMCSA Q3 Earnings Call Highlights Broadband and Restructuring finance.yahoo.com · 2026-10-23
What the article says
Comcast Corporation CMCSA outlined an extensive operational restructuring during its third-quarter 2026 earnings call, emphasizing cost reductions, customer retention and wireless expansion amid intensifying broadband competition. Although adjusted earnings exceeded the Zacks Consensus Estimate, management… source ↗
- Company News for Oct 23, 2026 finance.yahoo.com · 2026-10-23
What the article says
Lockheed Martin Corp.'s (LMT) shares climbed 7% after reporting third-quarter 2026 adjusted earnings of $7.97 per share, surpassing the Zacks Consensus Estimate of $7.49 per share. Shares of The Procter & Gamble Co. (PG) surged 5.6% after the company posted first-quarter fiscal 2027 adjusted earnings of $2.00 per… source ↗
- Comcast to cut cable jobs, take $1-billion-plus charge as broadband losses deepen finance.yahoo.com · 2026-10-22
What the article says
Comcast Corp. plans to cut jobs in its cable, broadband and wireless business and expects to take a charge of more than $1 billion in the fourth quarter. The Philadelphia-based company is trying to stem customer losses and streamline before it spins off NBCUniversal next year. The company lost 144,000 domestic… source ↗
What changed since last week
• Risk flag cleared: deep drawdown from the high.
• Risk flag cleared: earnings report coming up.
• The price rose 3.6% since the last summary.
• A new quarterly report was published (quarter ended Sep 30, 2026).
A description of facts from the filings and the market — not investment advice or a recommendation. "Cheap" and "expensive" are always relative to the comparison group. Educational information only — not investment advice. Not a registered investment adviser or broker-dealer.