 TechAnalyzer Pro
Constellation Energy Corp CEG
Stock research in plain language · As of Oct 25, 2026 · updated once a week, after the trading week closes
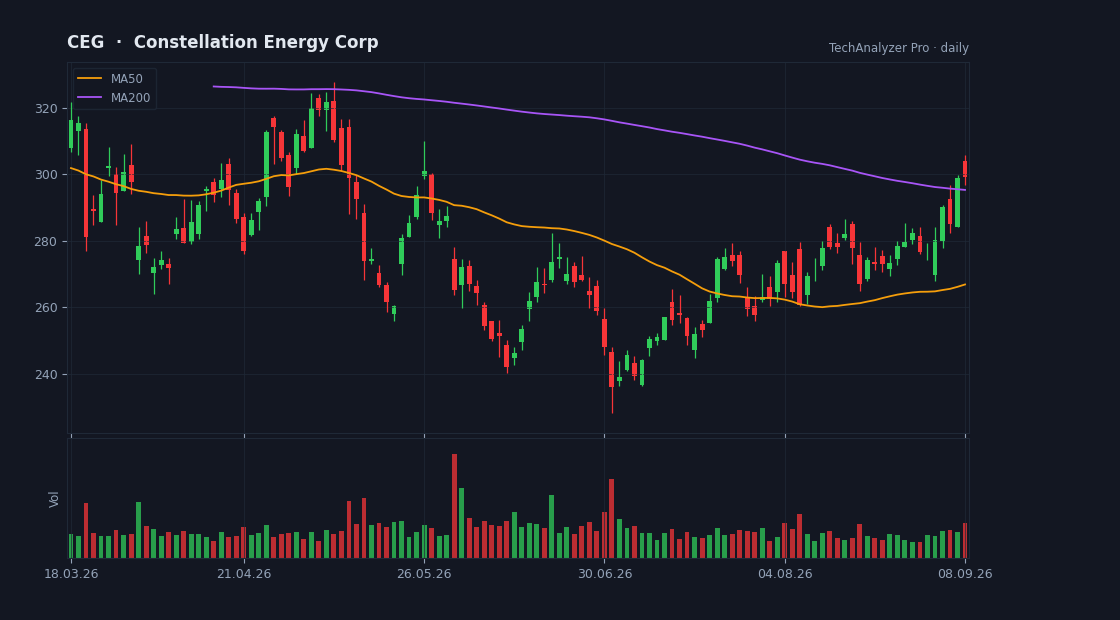
Daily candles, 50 and 200-day averages and volume · updated every trading day · click to open the live chart
What the company does
Constellation Energy Corp is a large-cap company in the Utilities sector (Utilities - Independent Power Producers), with a market value of $89.8B, based in the USA.
It employs about 15,291 people and has been listed since Feb 02, 2022.
Constellation Energy Corporation produces and sells energy products and services in the United States. The company operates through five segments: Mid-Atlantic, Midwest, New York, ERCOT, and Other Power Regions. It offers electricity, natural gas, energy-related products, and sustainable solutions.
Cheap or expensive? priced in line with its group
Its price-to-earnings (P/E) is 24.8 versus 22.4 for the median of the Utilities sector in our universe (9 companies) — priced in line with its group.
Revenue is growing 23% versus the same quarter last year.
On analysts' next-year forecasts the multiple drops to 20.7 — they expect higher earnings.
The average analyst price target is 338.07, 33% above the current price (their view, not ours).
The stock sits at 14% of its one-year range (0% = the low, 100% = the high).
The risks
- • More cash leaves than comes in (negative free cash flow).
- • The share count grew 13% in a year — each share owns a smaller slice of the company.
- • The stock is more volatile than average (beta 1.1) — big daily moves both ways.
- • The stock is 37% below its one-year high.
- • Quarterly report in 12 days (2026-11-06) — a day the stock can move a lot.
Strengths
- ✅ Profitable — 7 of every 100 dollars of revenue stays as profit.
- ✅ Most analysts rate it buy (21 vs 0).
- ✅ Revenue is growing 23% a year.
- ✅ Pays a dividend (0.6% a year).
What changed this week
Over the past week the stock fell 6.6% (for comparison: S&P 500 -0.4%, sector ETF XLU +0.8%).
This week's news
- Constellation Energy Corporation (CEG) is Attracting Investor Attention: Here is What You Should Know finance.yahoo.com · 2026-10-23
What the article says
Constellation Energy Corporation (CEG) has recently been on Zacks.com's list of the most searched stocks. Therefore, you might want to consider some of the key factors that could influence the stock's performance in the near future. Over the past month, shares of this company have returned -2.5%, compared to the Zacks… source ↗
- 3 Alternative Energy Stocks to Watch Amid Rising Power Demand finance.yahoo.com · 2026-10-23
What the article says
The global wind power market is expected to grow steadily, driven by supportive government policies, decarbonization efforts, energy security concerns and advancements in turbine technology. Meanwhile, rising electric vehicle adoption, declining battery costs and government incentives are boosting demand for clean… source ↗
- Constellation Energy And 2 Other Top Nuclear Power Stocks finance.yahoo.com · 2026-10-23
What the article says
Oil prices recently jumped above US$111 as attacks on Saudi energy facilities disrupted a key source of global supply. When fossil fuel routes look fragile, reliable baseload power suddenly matters a lot more. Nuclear energy stocks linked to uranium supply and reactor technology can appeal to investors who want… source ↗
- Constellation Energy (CEG) Signs Google Nuclear Deal, Is It Still Undervalued? finance.yahoo.com · 2026-10-22
What the article says
Constellation Energy (CEG) just locked in a 20 year nuclear power purchase agreement with Alphabet's Google, anchoring a long runway of contracted, carbon free supply for energy hungry data centers. The Google agreement lands after a mixed stretch for Constellation Energy's stock, with a 1-day share price gain of 4.6%… source ↗
- Why Constellation Energy Corporation (CEG) is Poised to Beat Earnings Estimates Again finance.yahoo.com · 2026-10-22
What the article says
If you are looking for a stock that has a solid history of beating earnings estimates and is in a good position to maintain the trend in its next quarterly report, you should consider Constellation Energy Corporation (CEG). This company, which is in the Zacks Alternative Energy - Other industry, shows potential for… source ↗
- What the Data Center Debate Gets Wrong finance.yahoo.com · 2026-10-22
What the article says
Utility bills don’t have to go up just because power demand is increasing. Smart investments could actually bring them down, Ryan Norris writes. Continue Reading source ↗
What changed since last week
• New risk flag: earnings report coming up.
• The price fell 6.6% since the last summary.
A description of facts from the filings and the market — not investment advice or a recommendation. "Cheap" and "expensive" are always relative to the comparison group. Educational information only — not investment advice. Not a registered investment adviser or broker-dealer.