 TechAnalyzer Pro
Citigroup Inc. C
Stock research in plain language · As of Oct 25, 2026 · updated once a week, after the trading week closes
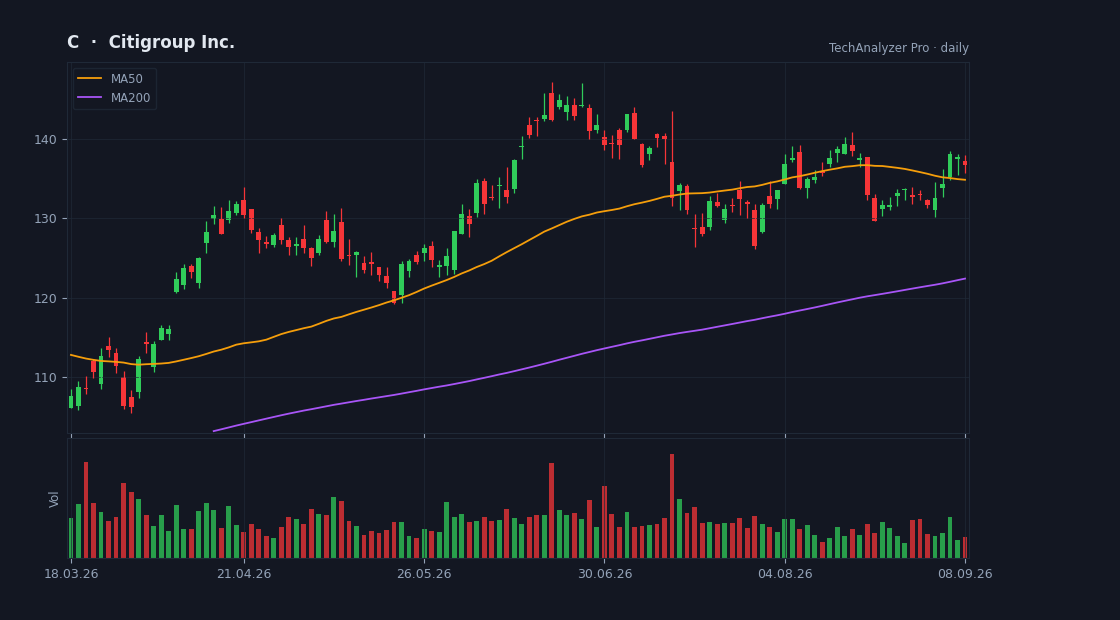
Daily candles, 50 and 200-day averages and volume · updated every trading day · click to open the live chart
What the company does
Citigroup Inc. is a mega-cap company in the Financial Services sector (Banks - Diversified), with a market value of $202.3B, based in the USA.
It employs about 217,000 people and has been listed since Jan 03, 1977.
Citigroup Inc., a diversified financial service holding company, provides various financial products and services to consumers, corporations, governments, and institutions. It operates through five segments: Services, Markets, Banking, U.S. Personal Banking, and Wealth.
Cheap or expensive? priced in line with its group
Its price-to-earnings (P/E) is 11.8 versus 12.3 for 4 direct peers — priced in line with its group.
Revenue is growing 8% versus the same quarter last year.
On analysts' next-year forecasts the multiple drops to 10.2 — they expect higher earnings.
The average analyst price target is 150.71, 25% above the current price (their view, not ours).
The stock sits at 50% of its one-year range (0% = the low, 100% = the high).
The risks
- No risk flags were detected from the data we have.
Strengths
- ✅ Profitable — 22 of every 100 dollars of revenue stays as profit.
- ✅ Buys back its shares (1% fewer shares in a year).
- ✅ More cash than debt.
- ✅ Most analysts rate it buy (18 vs 0).
- ✅ Pays a dividend (2.0% a year).
What changed this week
Over the past week the stock fell 2.9% (for comparison: S&P 500 -0.4%, sector ETF XLF +0.7%).
This week's news
- Mobileye (MBLY) Stock Gets Fair Value Trim As Analysts Split On Growth Risks finance.yahoo.com · 2026-10-23
What the article says
Mobileye Global has seen its modeled fair value price target adjusted from US$11.48 to US$11.11, a small move that still matters if you are tracking where analysts think the stock should trade. This shift sits against a divided Wall Street backdrop, with some analysts taking a more positive view of Mobileye Global's… source ↗
- FRN Variable Rate Fix finance.yahoo.com · 2026-10-23
What the article says
LONDON, October 23, 2026--(BUSINESS WIRE)-- Re: Macquarie Bank Ltd Australia. EUR 300,000,000.00 MATURING: 27-Jan-2028 ISIN: XS3280329452 PLEASE BE ADVISED THAT THE INTEREST RATE FOR THE PERIOD 27-Oct-2026 TO 27-Jan-2027 HAS BEEN FIXED AT 2.99 PCT DAY BASIS: ACTUAL/360 INTEREST PAYABLE VALUE 27-Jan-2027 WILL AMOUNT… source ↗
- Texas Capital Hits Record Revenues in Q3: Can Growth Momentum Continue? finance.yahoo.com · 2026-10-23
What the article says
Texas Capital Bancshares, Inc. TCBI delivered record revenues of $356.6 million in the third quarter of 2026, up 4.8% year over year. Growth reflected higher net interest income (NII) and higher non-interest income, highlighting the contribution of its lending and fee-generating businesses. During the quarter, NII… source ↗
- C's September Card Delinquencies Rise: Will This Impact Asset Quality? finance.yahoo.com · 2026-10-23
What the article says
Citigroup Inc. C continues to navigate credit-quality challenges amid an uncertain economic environment. According to its latest SEC filing, its subsidiary, Citibank N.A., reported higher credit card delinquencies and net principal losses in September 2026, while outstanding principal receivables declined during the… source ↗
- Here is What to Know Beyond Why Citigroup Inc. (C) is a Trending Stock finance.yahoo.com · 2026-10-23
What the article says
Citigroup (C) has been one of the most searched-for stocks on Zacks.com lately. So, you might want to look at some of the facts that could shape the stock's performance in the near term. Shares of this U.S. bank have returned -7.3% over the past month versus the Zacks S&P 500 composite's -1.2% change. The Zacks… source ↗
- AM Markets Need to Know: AI shorts gain $6B, chip stocks test support, and more seekingalpha.com · 2026-10-23
What the article says
[Expanding Global Connection Lines - Global Business, Financial Network, Flight Routes] DKosig Stock index futures were mixed on Friday, a day after a technology sell-off pushed the Nasdaq sharply lower. Here are the five news items investors should watch: SEMICONDUCTOR STOCKS TEST 200-DAY MOVING AVERAGE:… source ↗
What changed since last week
• New strength: dividend.
• New strength: net cash.
• No longer a strength: revenue growth.
A description of facts from the filings and the market — not investment advice or a recommendation. "Cheap" and "expensive" are always relative to the comparison group. Educational information only — not investment advice. Not a registered investment adviser or broker-dealer.