 TechAnalyzer Pro
BlackRock Inc BLK
Stock research in plain language · As of Oct 25, 2026 · updated once a week, after the trading week closes
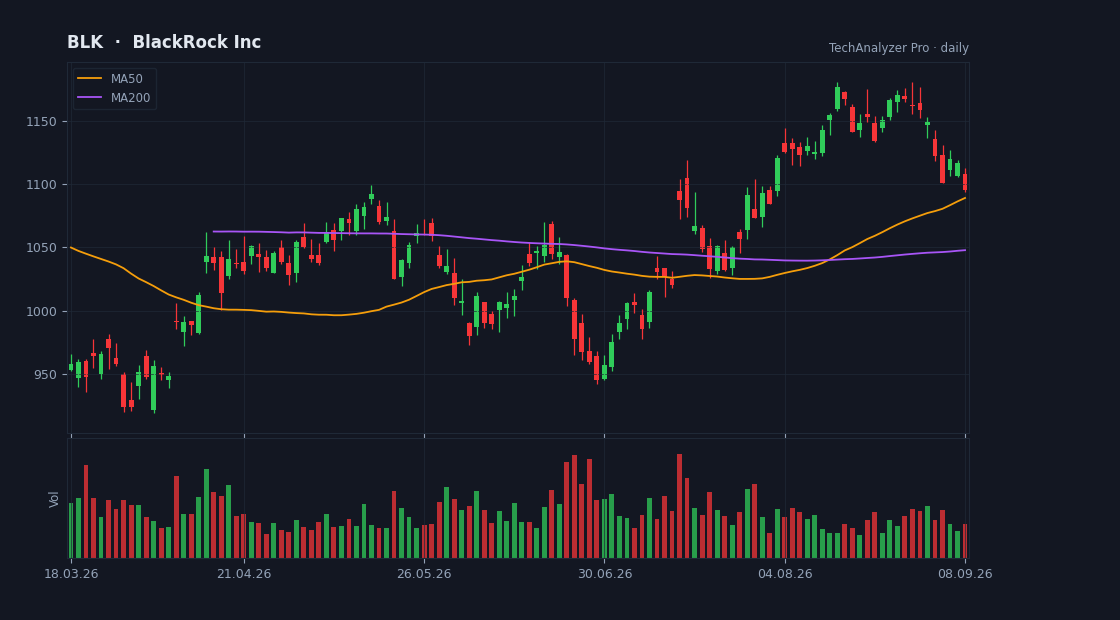
Daily candles, 50 and 200-day averages and volume · updated every trading day · click to open the live chart
What the company does
BlackRock Inc is a large-cap company in the Financial Services sector (Asset Management), with a market value of $181.7B, based in the USA.
It employs about 24,900 people and has been listed since Oct 01, 1999.
BlackRock, Inc. is a publicly owned investment manager. The firm primarily provides its services to institutional, intermediary, and individual investors including corporate, public, union, and industry pension plans, insurance companies, third-party mutual funds, endowments, public institutions, governments, foundations, charities, sovereign wealth funds, corporations, official institutions, and banks.
Cheap or expensive? relatively expensive
Its price-to-earnings (P/E) is 25.5 versus 14.1 for the median of the Financial Services sector in our universe (19 companies) — relatively expensive.
Revenue is growing 19% a year — the market is paying ahead for that growth. If it slows, the high multiple becomes the risk.
On analysts' next-year forecasts the multiple drops to 22.0 — they expect higher earnings.
The average analyst price target is 1351.00, 21% above the current price (their view, not ours).
The stock sits at 77% of its one-year range (0% = the low, 100% = the high).
The risks
- • The share count grew 5% in a year — each share owns a smaller slice of the company.
Strengths
- ✅ Profitable — 21 of every 100 dollars of revenue stays as profit.
- ✅ Most analysts rate it buy (17 vs 0).
- ✅ Revenue is growing 19% a year.
- ✅ Pays a dividend (2.0% a year).
What changed this week
Over the past week the stock fell 1.4% (for comparison: S&P 500 -0.4%, sector ETF XLF +0.7%).
This week's news
- BlackRock (BLK) Stock Could Be 11% Undervalued Following Bitcoin ETF Filing finance.yahoo.com · 2026-10-24
What the article says
BlackRock has seen its stock deliver a powerful run over the past few years, which naturally puts a spotlight on whether the current valuation is really backed by the returns the business earns on its capital. With the asset manager pushing deeper into areas like bitcoin-linked products, AI infrastructure financing… source ↗
- Bitcoin eyes $84,000 as whale withdrawals surge and institutional activity grows finance.yahoo.com · 2026-10-24
What the article says
Investing.com -- Bitcoin traded under $81,000 as large-holder withdrawals and institutional wallet activity raised hopes of a recovery towards $84,000, despite continued uncertainty across cryptocurrency markets. Still guessing which stocks will beat the market? Our AI portfolio updates monthly and is outperforming… source ↗
- RBC iShares / BlackRock (XBAI) Opens the Market finance.yahoo.com · 2026-10-23
What the article says
Toronto, Ontario--(Newsfile Corp. - October 23, 2026) - Steven Leong, Managing Director, Head of Canada Product and iShares, BlackRock, joined Graham MacKenzie, Managing Director, Exchange Traded Products, Toronto Stock Exchange ("TSX"), to open the market and celebrate the RBC iShares alliance expanding its exchange… source ↗
- Larry Fink says Americans’ retirement savings need to fund $10 trillion AI infrastructure needs. Protect your wealth finance.yahoo.com · 2026-10-23
What the article says
Moneywise and Yahoo Finance LLC may earn commission or revenue through links in the content below. Tech giants are expected to spend trillions of dollars on AI infrastructure in the coming years as they race to build the data centers, chips and energy capacity needed to support artificial intelligence. McKinsey has… source ↗
- BlackRock (BLK) Files Bitcoin Protection ETF And Launches Active Robotics Fund finance.yahoo.com · 2026-10-23
What the article says
BlackRock (NYSE:BLK) filed for the iShares Bitcoin Managed Protection ETF, a bitcoin-linked fund with a downside protection feature. The filing outlines a structure that targets exposure to bitcoin price moves while using risk management tools to limit losses. BlackRock also introduced an actively managed Robotics ETF… source ↗
- BlackRock's Angara on ETF Product Pipeline finance.yahoo.com · 2026-10-23
What the article says
Aarti Angara, APAC Head of Global Product Solutions at BlackRock, discusses the asset manager's recent ETF investor survey findings and ETF product offerings. She speaks on "Bloomberg: ETF IQ Asia." Video Transcript 00:13 Yvonne All right, welcome back. You're watching ETF IQ Asia. Of course, it's our special weekly… source ↗
What changed since last week
No material change: same valuation verdict, same risk flags, price moved less than 3%.
A description of facts from the filings and the market — not investment advice or a recommendation. "Cheap" and "expensive" are always relative to the comparison group. Educational information only — not investment advice. Not a registered investment adviser or broker-dealer.