 TechAnalyzer Pro
American Express Company AXP
Stock research in plain language · As of Oct 25, 2026 · updated once a week, after the trading week closes
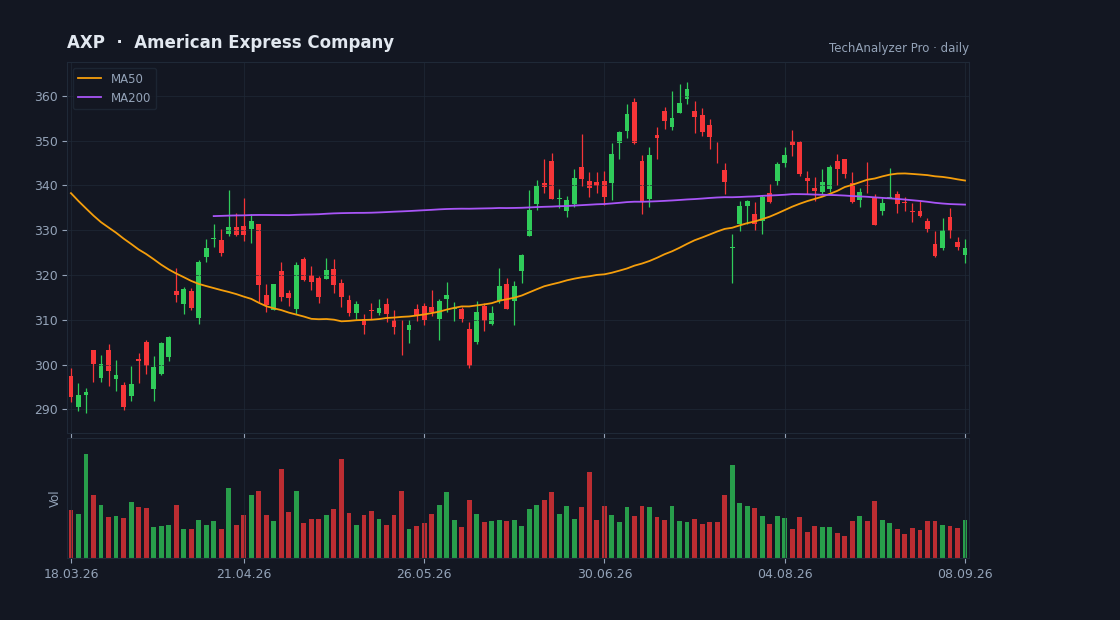
Daily candles, 50 and 200-day averages and volume · updated every trading day · click to open the live chart
What the company does
American Express Company is a mega-cap company in the Financial Services sector (Credit Services), with a market value of $211.5B, based in the USA.
It employs about 76,800 people and has been listed since Jun 01, 1972.
American Express Company, together with its subsidiaries, operates as an integrated payments company in the United States, Europe, the Middle East and Africa, the Asia Pacific, Australia, New Zealand, Latin America, Canada, the Caribbean, and internationally. It operates through four segments: U.S. Consumer Services, Commercial Services, International Card Services, and Global Merchant and Network Services.
Cheap or expensive? relatively cheap
Its price-to-earnings (P/E) is 19.0 versus 34.7 for 4 direct peers — relatively cheap.
Revenue is growing 13% versus the same quarter last year.
On analysts' next-year forecasts the multiple drops to 15.5 — they expect higher earnings.
The average analyst price target is 369.52, 18% above the current price (their view, not ours).
The stock sits at 26% of its one-year range (0% = the low, 100% = the high).
The risks
- No risk flags were detected from the data we have.
Strengths
- ✅ Profitable — 17 of every 100 dollars of revenue stays as profit.
- ✅ Generates free cash flow — profit becomes cash in the bank.
- ✅ Buys back its shares (3% fewer shares in a year).
- ✅ Most analysts rate it buy (15 vs 0).
What changed this week
Over the past week the stock fell 0.1% (for comparison: S&P 500 -0.4%, sector ETF XLF +0.7%).
The company published its quarterly report this week — see the plain-language summary above.
This week's news
- Earnings Scoreboard: 82% firms beat EPS estimates, 79% post Y/Y earnings growth seekingalpha.com · 2026-10-24
What the article says
[Top view image of text THIRD QUARTER on office desk.] mohd izzuan Earnings season gathered momentum during the last week, with 76 S&P 500 companies reporting results across key sectors, including Financials, Communication Services, Consumer Discretionary, Industrials, and Energy. The results offered a fresh look at… source ↗
- American Express (AXP) Stock Price Drops After Strong Q3 Earnings finance.yahoo.com · 2026-10-24
What the article says
American Express came into this Q3 2026 print with its stock near record territory and a reputation as the premium spend machine in consumer finance. The headline this quarter is simple. Revenue reached about US$19.8b and basic earnings per share landed near US$5.52, yet the share price dropped 3.7% on the day to… source ↗
- Earnings Scorecard: Financials log 80% EPS beat rate vs. revenue this week seekingalpha.com · 2026-10-24
What the article says
Financial stocks outperformed the broader market this week as investors assessed third-quarter earnings across banks, insurers, consumer finance providers, and capital-markets firms. The Financial Select Sector SPDR Fund (XLF [https://seekingalpha.com/symbol/XLF]) gained 2.35% over the week, while the S&P 500 (SP500… source ↗
- Albertsons Companies (ACI) Launches ForU Card And Plans Valley Center Store finance.yahoo.com · 2026-10-24
What the article says
Albertsons Companies (NYSE:ACI) introduced the Albertsons forU American Express Card with partners American Express and Imprint, expanding its loyalty offering across more than 2,200 stores. The co-branded credit card targets digital rewards engagement for Albertsons forU members, adding new payment and points-earning… source ↗
- American Express (AXP) stock trades down, here is why finance.yahoo.com · 2026-10-24
What the article says
What happened? Shares of global payments company American Express (NYSE:AXP) fell 3.5% in the afternoon session after the company announced plans to eliminate roughly 5% of its workforce, or about 4,000 employees, alongside its third-quarter 2026 financial results. According to CNBC, the cuts are American Express's… source ↗
- How To Earn $500 A Month From American Express Stock Ahead Of Q3 Earnings finance.yahoo.com · 2026-10-24
What the article says
Benzinga and Yahoo Finance LLC may earn commission or revenue on some items through the links below. American Express Co will release its third-quarter earnings report before the opening bell on Friday, Oct. 23. Analysts expect the company to report quarterly earnings of $4.50 per share, up from $4.14 per share in the… source ↗
What changed since last week
• Risk flag cleared: earnings report coming up.
• No longer a strength: dividend.
• A new quarterly report was published (quarter ended Sep 30, 2026).
A description of facts from the filings and the market — not investment advice or a recommendation. "Cheap" and "expensive" are always relative to the comparison group. Educational information only — not investment advice. Not a registered investment adviser or broker-dealer.