 TechAnalyzer Pro
Applied Materials Inc AMAT
Stock research in plain language · As of Oct 25, 2026 · updated once a week, after the trading week closes
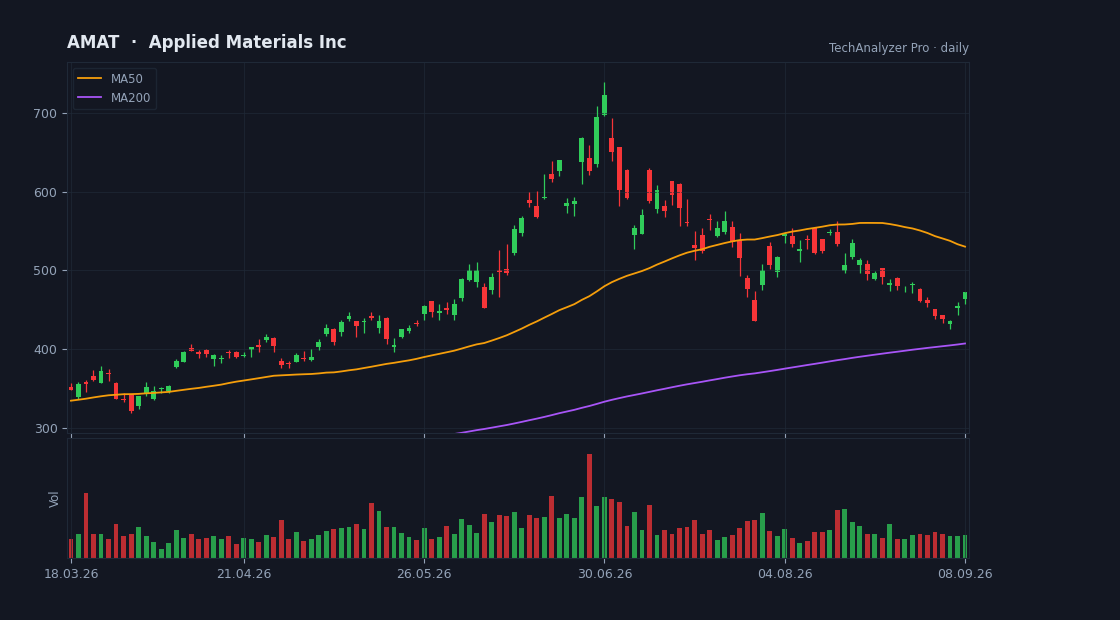
Daily candles, 50 and 200-day averages and volume · updated every trading day · click to open the live chart
What the company does
Applied Materials Inc is a mega-cap company in the Technology sector (Semiconductor Equipment & Materials), with a market value of $299.4B, based in the USA.
It employs about 38,900 people and has been listed since Oct 05, 1972.
Applied Materials, Inc. provides materials engineering solutions, equipment, services, and software to the semiconductor and related industries in the United States, China, Korea, Taiwan, Japan, Southeast Asia, Europe, and internationally. The company operates through Semiconductor Systems and Applied Global Services (AGS) segments.
Cheap or expensive? priced in line with its group
Its price-to-earnings (P/E) is 32.5 versus 38.7 for the median of the Technology sector in our universe (65 companies) — priced in line with its group.
Revenue is growing 25% versus the same quarter last year.
On analysts' next-year forecasts the multiple drops to 23.4 — they expect higher earnings.
The average analyst price target is 627.83, 66% above the current price (their view, not ours).
The stock sits at 33% of its one-year range (0% = the low, 100% = the high).
The risks
- • The stock is more volatile than average (beta 1.6) — big daily moves both ways.
- • The stock is 49% below its one-year high.
Strengths
- ✅ Profitable — 28 of every 100 dollars of revenue stays as profit.
- ✅ Generates free cash flow — profit becomes cash in the bank.
- ✅ Buys back its shares (1% fewer shares in a year).
- ✅ More cash than debt.
- ✅ Most analysts rate it buy (34 vs 0).
- ✅ Revenue is growing 25% a year.
- ✅ Pays a dividend (0.5% a year).
What changed this week
Over the past week the stock fell 7.8% (for comparison: S&P 500 -0.4%, sector ETF XLK -0.1%).
This week's news
- Applied Materials (AMAT) Stock Could Be 35% Above Fair Value After AI Manufacturing News finance.yahoo.com · 2026-10-23
What the article says
Applied Materials has posted a powerful share-price run over the past few years, yet a sharp pullback in recent weeks now puts the focus squarely on one issue. Are the cash flows from its chip equipment and services business enough to support where the stock trades today? Over the past 3 years the stock has gained… source ↗
- The Trouble for Lam Research, Applied Materials, and KLA Stock Could Be Just Getting Started finance.yahoo.com · 2026-10-23
What the article says
Lam Research, Applied Materials, and KLA are all under pressure. Citi believes there’s even more downside potential after the three stocks have booked big declines as of late. Continue Reading source ↗
- Should KLAC Stock Be in Your Portfolio Pre-Q1 Earnings Results? finance.yahoo.com · 2026-10-23
What the article says
KLA KLAC is set to report its first-quarter fiscal 2027 results on Oct. 28. For the to-be-reported quarter, KLAC expects revenues of $4 billion, plus/minus $200 million. The Zacks Consensus Estimate for revenues is pegged at $4.05 billion, indicating an increase of 26.09% from the year-ago quarter's reported figure.… source ↗
- AMAT vs. LRCX: Which Stock Has an Edge in the WFE Space? finance.yahoo.com · 2026-10-23
What the article says
Applied Materials AMAT and Lam Research LRCX stand out as key suppliers of wafer fabrication equipment (WFE) like Chemical Vapor Deposition, Atomic Layer Deposition (ALD), Physical Vapor Deposition, Chemical Mechanical Planarization Epitaxy and etching tools to serve various stages of chip manufacturing. With the AI… source ↗
- Albert Invent Welcomes Applied Ventures as Investor finance.yahoo.com · 2026-10-23
What the article says
The investment will help Albert expand its chemistry-native AI platform, fostering materials innovation and accelerating the adoption of next-generation technologies across the global R&D ecosystem. OAKLAND, Calif., October 23, 2026--(BUSINESS WIRE)--Albert Invent Corp., the AI platform designed to transform how the… source ↗
- Applied Materials, Lam Research, KLA Corporation, FormFactor, and Penguin Solutions shares plummet, what you need to know finance.yahoo.com · 2026-10-23
What the article says
What happened? A number of stocks fell in the afternoon session after warnings emerged that ongoing component supply chain bottlenecks and cleanroom space constraints will restrict semiconductor equipment makers from meeting demand through 2027. CNBC reported that semiconductor equipment maker Lam Research highlighted… source ↗
What changed since last week
• The price fell 15.5% since the last summary.
A description of facts from the filings and the market — not investment advice or a recommendation. "Cheap" and "expensive" are always relative to the comparison group. Educational information only — not investment advice. Not a registered investment adviser or broker-dealer.