 TechAnalyzer Pro
American International Group Inc AIG
Stock research in plain language · As of Oct 25, 2026 · updated once a week, after the trading week closes
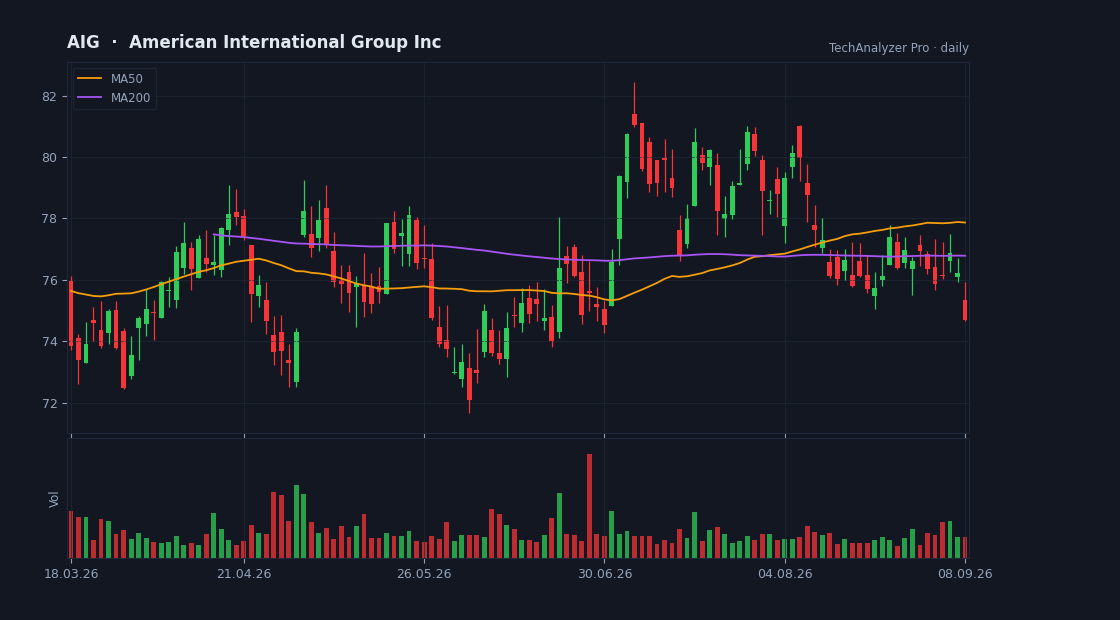
Daily candles, 50 and 200-day averages and volume · updated every trading day · click to open the live chart
What the company does
American International Group Inc is a large-cap company in the Financial Services sector (Insurance - Diversified), with a market value of $42.5B, based in the USA.
It employs about 22,100 people and has been listed since Sep 07, 1984.
American International Group, Inc. provides insurance products for commercial, institutional, and individual customers in North America and internationally. It operates through three segments: North America Commercial, International Commercial, and Global Personal.
Cheap or expensive? priced in line with its group
Its price-to-earnings (P/E) is 15.2 versus 14.1 for the median of the Financial Services sector in our universe (19 companies) — priced in line with its group.
Revenue is growing 0% versus the same quarter last year.
On analysts' next-year forecasts the multiple drops to 8.6 — they expect higher earnings.
The average analyst price target is 87.70, 8% above the current price (their view, not ours).
The stock sits at 72% of its one-year range (0% = the low, 100% = the high).
The risks
- • Quarterly report in 9 days (2026-11-03) — a day the stock can move a lot.
Strengths
- ✅ Profitable — 13 of every 100 dollars of revenue stays as profit.
- ✅ Generates free cash flow — profit becomes cash in the bank.
- ✅ Buys back its shares (9% fewer shares in a year).
- ✅ More cash than debt.
- ✅ Most analysts rate it buy (8 vs 0).
- ✅ Pays a dividend (2.2% a year).
What changed this week
Over the past week the stock rose 0.6% (for comparison: S&P 500 -0.4%, sector ETF XLF +0.7%).
No notable news about the company was found in the past week.
What changed since last week
• New risk flag: earnings report coming up.
A description of facts from the filings and the market — not investment advice or a recommendation. "Cheap" and "expensive" are always relative to the comparison group. Educational information only — not investment advice. Not a registered investment adviser or broker-dealer.