 TechAnalyzer Pro
Airbnb Inc ABNB
Stock research in plain language · As of Oct 25, 2026 · updated once a week, after the trading week closes
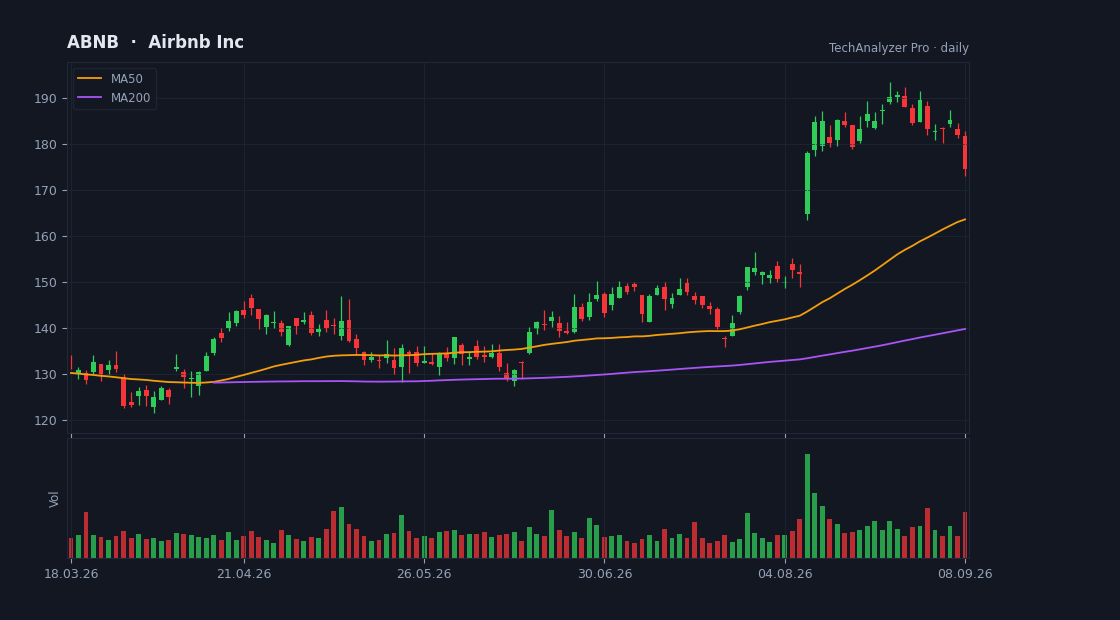
Daily candles, 50 and 200-day averages and volume · updated every trading day · click to open the live chart
What the company does
Airbnb Inc is a large-cap company in the Consumer Cyclical sector (Travel Services), with a market value of $103.0B, based in the USA.
It employs about 8,200 people and has been listed since Dec 10, 2020.
Airbnb, Inc., together with its subsidiaries, operates a platform for stays, experiences, and services worldwide. The company's marketplace connects hosts and guests online or through mobile devices to book spaces, experiences, and services. It also offers gift cards.
Cheap or expensive? priced in line with its group
Its price-to-earnings (P/E) is 39.2 versus 29.2 for 4 direct peers — priced in line with its group.
Revenue is growing 16% versus the same quarter last year.
On analysts' next-year forecasts the multiple drops to 29.0 — they expect higher earnings.
The average analyst price target is 183.45, 7% above the current price (their view, not ours).
The stock sits at 74% of its one-year range (0% = the low, 100% = the high).
The risks
- • Quarterly report in 11 days (2026-11-05) — a day the stock can move a lot.
Strengths
- ✅ Profitable — 23 of every 100 dollars of revenue stays as profit.
- ✅ Generates free cash flow — profit becomes cash in the bank.
- ✅ Buys back its shares (5% fewer shares in a year).
- ✅ More cash than debt.
- ✅ Most analysts rate it buy (26 vs 2).
- ✅ Revenue is growing 16% a year.
What changed this week
Over the past week the stock fell 1.0% (for comparison: S&P 500 -0.4%, sector ETF XLY +0.6%).
This week's news
- Airbnb (ABNB) Stock May Be 39% Undervalued Despite New Travel Booking Deal finance.yahoo.com · 2026-10-23
What the article says
Airbnb shares have logged a strong run over the past few years, which puts fresh attention on whether the current US$175.76 price is supported by the cash the business is expected to generate. With the stock now carrying solid medium term returns, the key issue for you is how that share performance lines up against an… source ↗
- Airbnb (ABNB) is an Incredible Growth Stock: 3 Reasons Why finance.yahoo.com · 2026-10-23
What the article says
Growth investors focus on stocks that are seeing above-average financial growth, as this feature helps these securities garner the market's attention and deliver solid returns. But finding a growth stock that can live up to its true potential can be a tough task. In addition to volatility, these stocks carry… source ↗
- Airbnb is limiting chores that hosts can require in new rule finance.yahoo.com · 2026-10-23
What the article says
The 8:30 Hosts Jake Conley, Julie Hyman, and Pras Subramanian discuss Airbnb's (ABNB) latest policy limiting chores that hosts and property owners must require from guests, which can range from taking the trash out to changing bedsheets and linens. Video Transcript 00:00 Speaker A Airbnb is trying to tackle one of the… source ↗
- SpaceX is raising debt for AI, and Apple's new iPhone Duo has been released finance.yahoo.com · 2026-10-23
What the article says
The 8:30 hosts Julie Hyman, Jake Conely, and Pras Subramanian tackle the top stories of the day. Including Apple's (AAPL) iPhone Duo hitting stores, Airbnb's (ABNB) new rules for owners, and the 10-year yield falling below 5%. The 8:30 team is then joined by EZPR CEO Ed Zitron to talk about SpaceX (SPCX) raising $40B… source ↗
- Is GIII Apparel Group (GIII) Stock Outpacing Its Consumer Discretionary Peers This Year? finance.yahoo.com · 2026-10-23
What the article says
For those looking to find strong Consumer Discretionary stocks, it is prudent to search for companies in the group that are outperforming their peers. Is G-III Apparel Group (GIII) one of those stocks right now? By taking a look at the stock's year-to-date performance in comparison to its Consumer Discretionary peers,… source ↗
What changed since last week
• New risk flag: earnings report coming up.
A description of facts from the filings and the market — not investment advice or a recommendation. "Cheap" and "expensive" are always relative to the comparison group. Educational information only — not investment advice. Not a registered investment adviser or broker-dealer.