 TechAnalyzer Pro
Wix.Com Ltd WIX
Stock research in plain language · As of Oct 12, 2026 · updated once a week, after the trading week closes
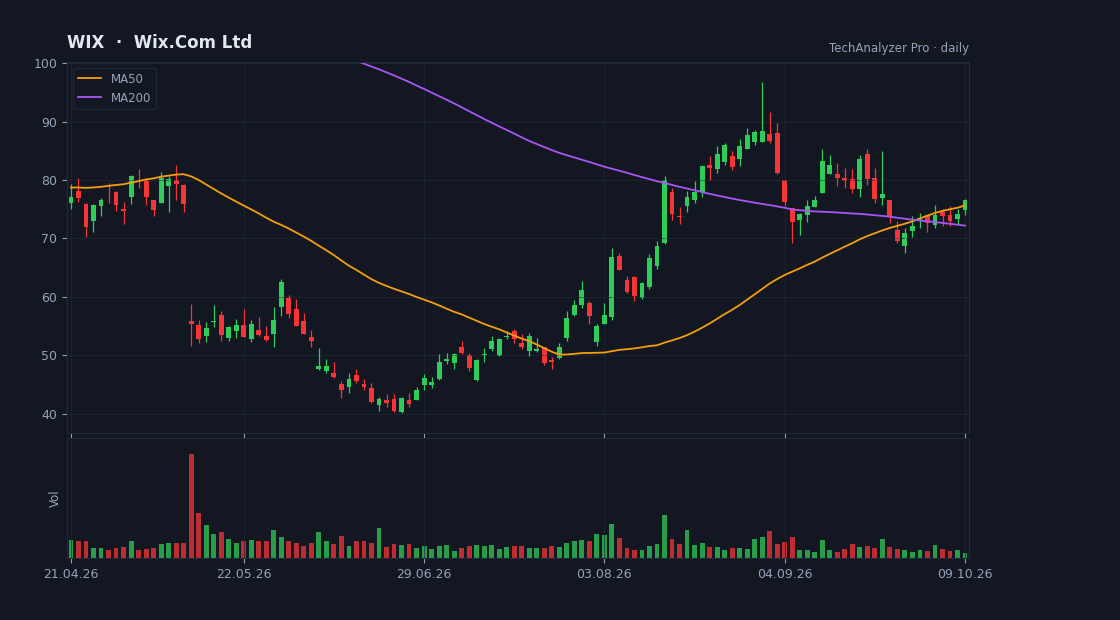
Daily candles, 50 and 200-day averages and volume · updated every trading day · click to open the live chart
What the company does
Wix.Com Ltd is a mid-cap company in the Technology sector (Software - Infrastructure), with a market value of $4.5B, based in the USA.
It employs about 4,371 people and has been listed since Nov 06, 2013.
Wix.com Ltd. operates a cloud-based web development platform for registered users and creators in the United States, Europe, Israel, and internationally. The company offers Wix Editor, a drag-and-drop visual development and website editing environment platform and Wix Studio, a unified website development platform that enables the creation of advanced websites.
Cheap or expensive? relatively cheap
The company is loss-making, so it has no P/E — we compare on price-to-sales instead.
Its price-to-sales (P/S) is 1.5 versus 7.4 for the median of the Technology sector in our universe (65 companies) — relatively cheap.
Revenue is growing 15% versus the same quarter last year.
The average analyst price target is 79.65, 4% above the current price (their view, not ours).
The stock sits at 34% of its one-year range (0% = the low, 100% = the high).
The risks
- • The company is loss-making.
- • The stock is more volatile than average (beta 1.0) — big daily moves both ways.
- • 19% of the float is sold short — part of the market is betting on a decline.
- • The stock is 48% below its one-year high.
Strengths
- ✅ Generates free cash flow — profit becomes cash in the bank.
- ✅ Buys back its shares (28% fewer shares in a year).
- ✅ Most analysts rate it buy (11 vs 1).
What changed this week
Over the past week the stock rose 5.4% (for comparison: S&P 500 +1.2%, sector ETF XLK -0.5%).
No notable news about the company was found in the past week.
What changed since last week
This is the first summary for this stock; from next week this section shows what changed.
A description of facts from the filings and the market — not investment advice or a recommendation. "Cheap" and "expensive" are always relative to the comparison group.