 TechAnalyzer Pro
Taboola TBLA
Stock research in plain language · As of Oct 12, 2026 · updated once a week, after the trading week closes
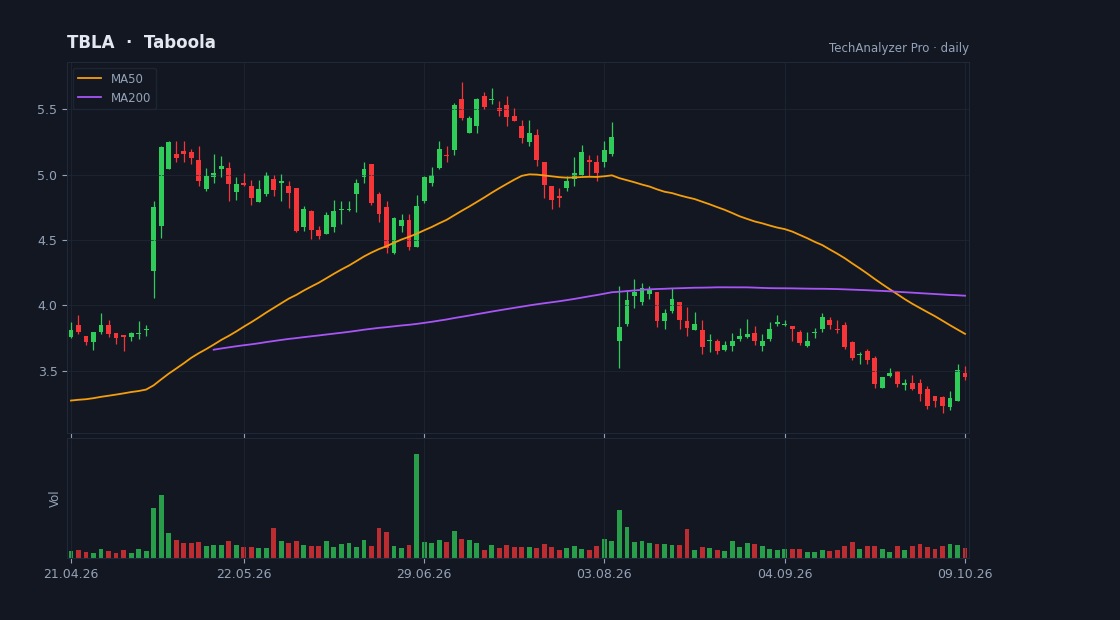
Daily candles, 50 and 200-day averages and volume · updated every trading day · click to open the live chart
What the company does
Taboola is a small-cap company in the Communication Services sector (Internet Content & Information), with a market value of $932M, based in the USA.
It employs about 2,000 people and has been listed since Jun 30, 2021.
Taboola.com Ltd., together with its subsidiaries, operates an artificial intelligence-based algorithmic engine platform in Israel, the United States, the United Kingdom, Germany, and internationally. It offers Taboola, which is a platform that partners with websites, devices, and mobile apps to recommend editorial content and advertisements on the open web. The company was incorporated in 2006 and is headquartered in New York, New York.
Cheap or expensive? relatively cheap
Its price-to-earnings (P/E) is 8.8 versus 15.0 for the median of the Communication Services sector in our universe (18 companies) — relatively cheap.
Revenue is growing 2% versus the same quarter last year.
On analysts' next-year forecasts the multiple rises to 84.7 — they expect lower earnings.
The average analyst price target is 5.80, 68% above the current price (their view, not ours).
The stock sits at 21% of its one-year range (0% = the low, 100% = the high).
The risks
- • The stock is more volatile than average (beta 1.5) — big daily moves both ways.
- • The stock is 40% below its one-year high.
Strengths
- ✅ Profitable — 1 of every 100 dollars of revenue stays as profit.
- ✅ Generates free cash flow — profit becomes cash in the bank.
- ✅ Buys back its shares (7% fewer shares in a year).
- ✅ More cash than debt.
- ✅ Most analysts rate it buy (5 vs 0).
What changed this week
Over the past week the stock rose 6.8% (for comparison: S&P 500 +1.2%, sector ETF XLC +0.1%).
No notable news about the company was found in the past week.
What changed since last week
This is the first summary for this stock; from next week this section shows what changed.
A description of facts from the filings and the market — not investment advice or a recommendation. "Cheap" and "expensive" are always relative to the comparison group.