 TechAnalyzer Pro
Altria Group (MO) daily technical analysis
Automated daily analysis of Altria Group as of the 2026-10-30 candle. Updated 2026-10-31, every trading day.
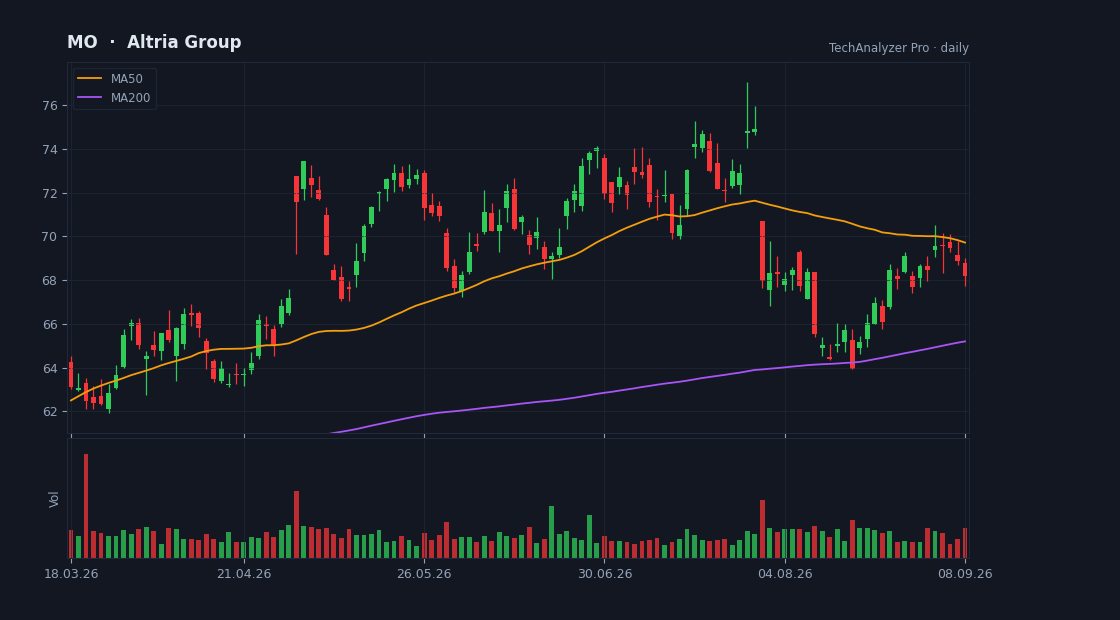
Altria Group at a glance
Altria Group (MO) daily technical analysis for 2026-10-30. Last price 78.03 (+1.67% on the day). The trend is up and RSI(14) is 70. Price is +11.3% from the 50-day and +16.1% from the 200-day moving average. There is no active setup right now. Technical information only, not investment advice.
Price is 2.2% below the 52-week high (79.81) and 49.6% above the 52-week low (52.17). Performance: 1 month +16.5%, 3 months +16.1%, 1 year +34.4%. Average daily range (ATR-14) is 2.2% of the price.
Latest technical setup
There is no active setup right now. The engine requires structure, reward-to-risk and a supportive market regime before it grades a setup.
Patterns, levels that update with every candle, and the public record of every signal — including the losses.
Open MO in the app — no sign-upAbout Altria Group
Altria Group, Inc., through its subsidiaries, manufactures and sells smokeable and oral tobacco products in the United States. It offers cigarettes primarily under the Marlboro brand; large cigars and pipe tobacco under the Black & Mild brand; moist smokeless tobacco and oral tobacco products under …
MO FAQ
What is the trend of MO?
The daily trend of Altria Group is classified as uptrend. Price is +11.3% from its 50-day moving average and +16.1% from its 200-day. The trend is computed by fixed rules from the moving averages and price structure, not by opinion.
What is the RSI of MO?
RSI(14) is 70, in overbought territory (70+) — momentum is stretched.
Where are the support and resistance levels of MO?
On the daily chart the nearest support is 71.34 (touched 2 times). Levels are detected automatically from swing points and update with every candle.
How far is MO from its 52-week high?
The 52-week high is 79.81 and the current price is 2.2% below it. Distance from the high is context, not a signal.
Is there a buy or sell recommendation for MO?
No. This page gives no buy or sell recommendations and is not investment advice. It shows automated, rule-based technical analysis — trend, support and resistance, indicators and volume — to save research time. The decision and the verification are yours.
More: all stock analyses · technical analysis guides · pricing · embed the MO analysis on your site — free widget