 TechAnalyzer Pro
The Kraft Heinz Company (KHC) daily technical analysis
Automated daily analysis of The Kraft Heinz Company as of the 2026-10-30 candle. Updated 2026-10-31, every trading day.
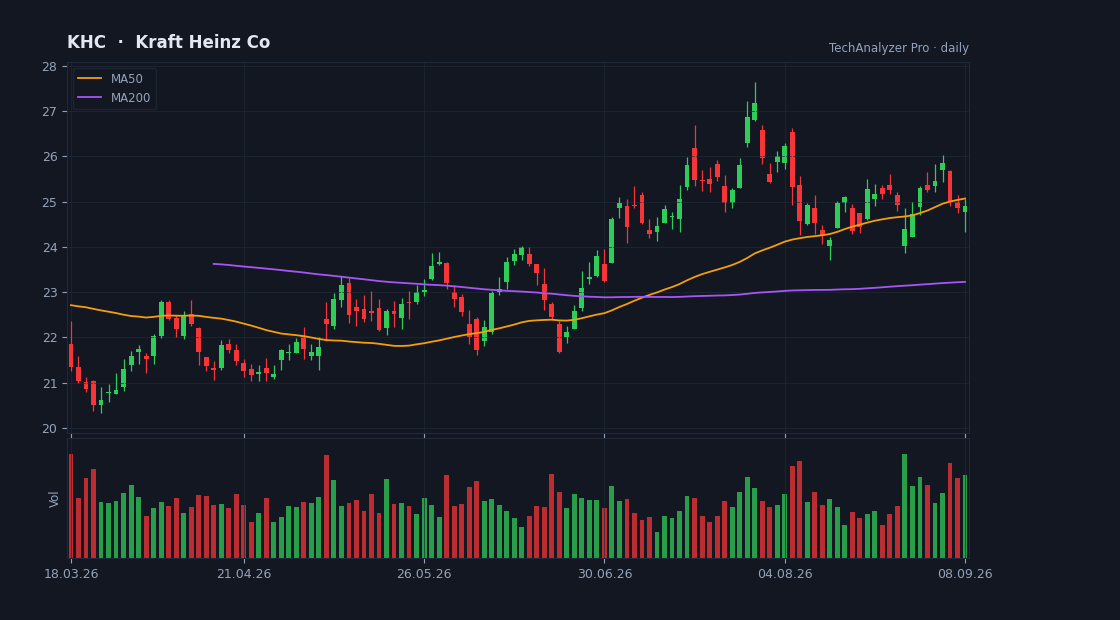
The Kraft Heinz Company at a glance
The Kraft Heinz Company (KHC) daily technical analysis for 2026-10-30. Last price 24.34 (+1.84% on the day). The trend is sideways and RSI(14) is 56. Price is +1.6% from the 50-day and +4.4% from the 200-day moving average. There is no active setup right now. Technical information only, not investment advice.
Price is 12.0% below the 52-week high (27.65) and 19.7% above the 52-week low (20.34). Performance: 1 month +8.4%, 3 months -6.4%, 1 year +6.7%. Average daily range (ATR-14) is 2.5% of the price.
Latest technical setup
There is no active setup right now. The engine requires structure, reward-to-risk and a supportive market regime before it grades a setup.
Patterns, levels that update with every candle, and the public record of every signal — including the losses.
Open KHC in the app — no sign-upAbout The Kraft Heinz Company
The Kraft Heinz Company, together with its subsidiaries, manufactures and markets food and beverage products in North America and internationally. Its products include condiments, sauces, dressings, and spreads; cheese, frozen potato products, and other frozen meals; meal kits, frozen snacks, and pi…
KHC FAQ
What is the trend of KHC?
The daily trend of The Kraft Heinz Company is classified as sideways. Price is +1.6% from its 50-day moving average and +4.4% from its 200-day. The trend is computed by fixed rules from the moving averages and price structure, not by opinion.
What is the RSI of KHC?
RSI(14) is 56, in the middle of the range — not at an extreme.
Where are the support and resistance levels of KHC?
On the daily chart the nearest support is 23.69 (touched 3 times). Levels are detected automatically from swing points and update with every candle.
How far is KHC from its 52-week high?
The 52-week high is 27.65 and the current price is 12.0% below it. Distance from the high is context, not a signal.
Is there a buy or sell recommendation for KHC?
No. This page gives no buy or sell recommendations and is not investment advice. It shows automated, rule-based technical analysis — trend, support and resistance, indicators and volume — to save research time. The decision and the verification are yours.
More: all stock analyses · technical analysis guides · pricing · embed the KHC analysis on your site — free widget